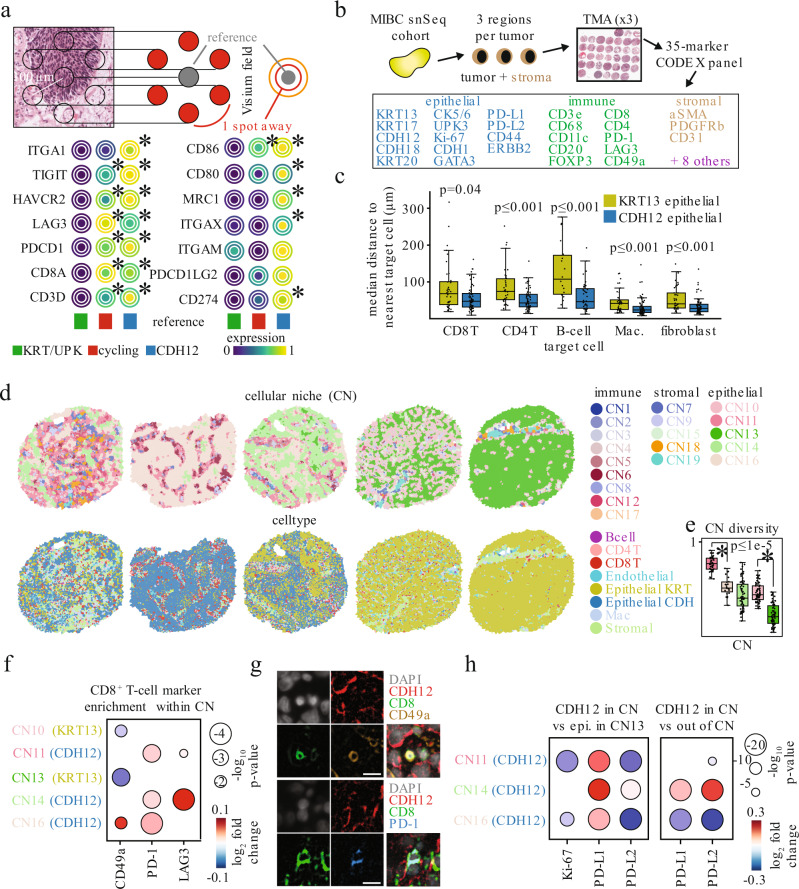
Fig. 5. CDH12 tumor cells preferentially colocalize with T-cells expressing CD49a, PD-1, and LAG3.
a Schematic for topological analysis on the Visium spot hexagonal grid where the average expression of a gene is shown in a reference spot (gray) along with the average expression of the same gene in the spots located 1 spot away from the reference (red) or 2 spots away from the reference (orange) (top). Average expression of T-cell exhaustion and other immune markers surrounding spots enriched for each of 3 different Visium-derived epithelial signatures (bottom). * indicates p < 0.05 using a Fisher exact test for testing the association of expression of a given gene with enrichment of a given epithelial score. b Schematic of a MIBC tissue microarray (TMA) for multiplexed immunohistochemistry via CO-Detection by indEXing (CODEX). The CODEX panel consisted of 35 markers targeting epithelial, immune, and stromal cell types identified via snSeq analysis. c Median spatial distance per TMA spot of KRT13+ (yellow) or CDH12+ (blue) epithelial cells to the nearest B-cell, CD4+ T-cell, CD8+ T-cell, macrophage, or fibroblast. * - Mann-Whitney, two-sided, p < 0.05. n = 36, 63, 34, 63, 18, 40, 40, 66, 41, 68 for each box from left to right. Source data are available as a Source data file. d Voronoi diagrams of cellular neighborhoods (CN; top) and cell types (bottom). CN’s were identified by k-means clustering the distribution of cell types neighboring each cell. Spots were chosen based on the number of cells belonging to each of the 5 epithelial cell enriched CN’s. e Cellular diversity measured by the Shannon entropy of the cell types composing each of 5 epithelial enriched CN’s. * - Mann-Whitney, two-sided, p < 0.05. n = 42, 23, 63, 68, 67 for each box from left to right. Source data are available as a Source data file. f Marker intensity enrichment on CD8+ T-cells residing within each CN, compared against CD8+ T-cells residing in any other CN. Only Wilcoxon (two-sided) p < 0.05 are shown. g Sample images from n = 1 representative sample depicting a CD49a+ CD8+ T-cell (top), and PD-1+ CD8+ T-cell (bottom) in the immediate vicinity of CDH12+ epithelial cells in-situ. Scale bar - 11 μm. h Marker intensity enrichment on CDH12+ epithelial cells within each CDH12 enriched CN compared with CDH12- epithelial cells within CN13 (left) or CDH12+ cells residing in any other CN (right). Only Wilcoxon (two-sided) p < 0.05 are shown. Boxplots are drawn as the inter-quartile range (IQR) with a line indicating the median, and outliers defined as points that fall outside of the range demarcated by 1.5*IQR.

