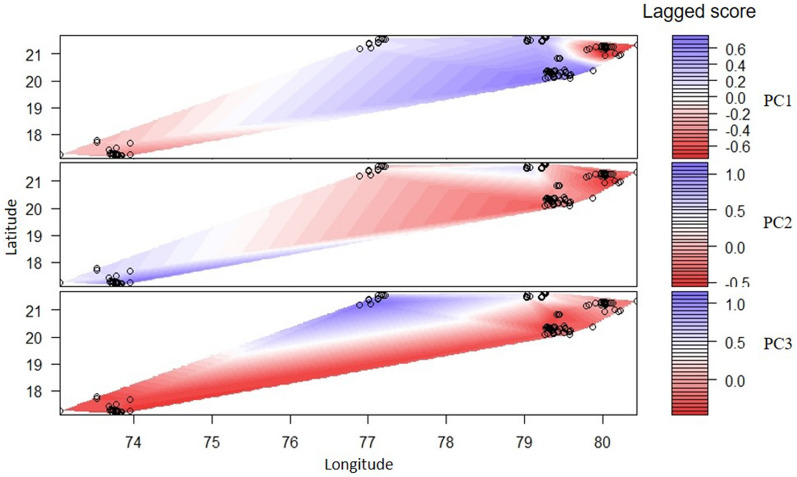
Figure 2.
Results of genetic differentiation from sPCA analysis. The results are presented as heatmaps where higher differentiation corresponds to positive eigenvalue score of significant global genetic structure (presented as red colour), whereas lower values are shown as blue colour. The black circles represent the unique dhole individuals from different areas of this landscape. The figure was generated using the package “adegenet” in R studio R Core Team (2019). R: A language and environment for statistical computing. R Foundation for Statistical Computing, Vienna, Austria. (https://www.R-project.org/).

