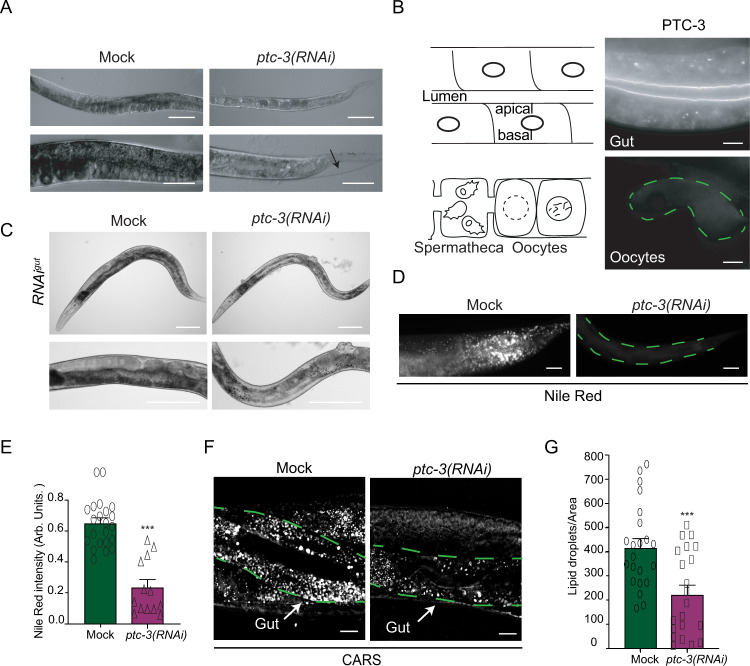
Fig. 1. Loss of PTC-3 causes developmental defects and loss of fat content.
A Light microscopy images of adult N2 worms grown from L2 larva on mock or ptc-3(RNAi) bacteria. This feeding scheme was used for comparison between mock-treated and ptc-3(RNAi) adult animals. ptc-3(RNAi) animals are smaller, paler, and show cuticle defects. The arrow points to a cuticular defect. Scale bars upper panel 20 µm, lower panels 100 µm. n = 25 (mock) and 26 (ptc-3(RNAi)) animals from 3 independent experiments. B Immunofluorescence of isolated intestine and gonad from wild-type worms. Schematic representation of the intestine and the proximal gonad. PTC-3 is present at the intestinal apical membrane. n = 20 from 3 independent experiments. Scale bar 10 µm. (C) PTC-3 has cell-autonomous and non-cell-autonomous functions. Light microscopy images of adult gut-specific RNAi worms (RNAigut) grown from L1 larva on mock or ptc-3(RNAi) bacteria. ptc-3(RNAigut) animals show intestinal and vulval defects. Scale bars 100 µm. n = 16 (mock) and 27 (ptc-3(RNAi)) animals from three independent experiments. D Lipid content is reduced in ptc-3(RNAi) animals. Nile Red staining of adult mock and ptc-3(RNAi) treated worms after L2 stage. Scale bars 20 µm. E Quantification of Nile Red staining shown in (D). Mean and SEM error bars. *** p = 0.000003, n = 22 (mock) and 13 (ptc-3(RNAi)) animals. One-way ANOVA including data on Fig. 3C. F CARS microscopy reveals reduction of lipid levels in live adult ptc-3(RNAi) after L2 stage fed animals. Scale bars 10 μm. The intestine is outlined by green dashed lines. Arrows point to the intestine. G Quantification of CARS signal. Mean and SEM error bars. ***p = 0.000524. n = 22 (mock) and 21 (ptc-3(RNAi)); one-way ANOVA. Statistical source data are available as source data.

