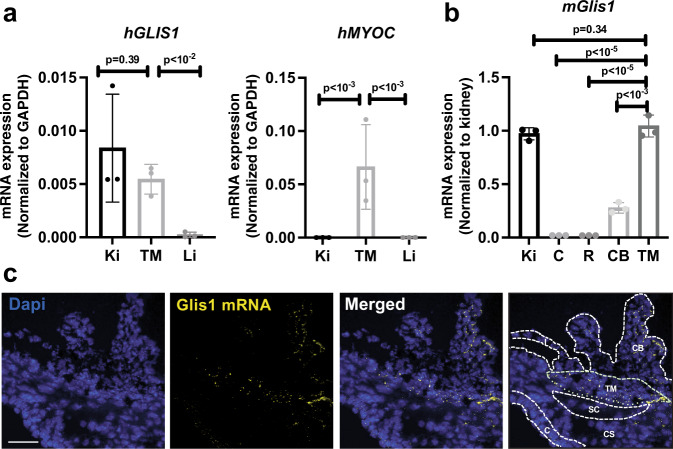
Fig. 3. GLIS1 is highly expressed in TM.
a QPCR analysis of GLIS1 and MYOC mRNA expression in human TM tissue, kidney (Ki), and liver (Li) (n = 3; technical replicates). Statistical analyses were performed with a two-tailed Student’s t test. Data are represented as means ± SD. p Values are indicated above the bars. b Comparison of mouse GLIS1 RNA expression in several ocular tissues with that of kidney, a tissue in which GLIS1 is highly expressed (n = 3; distinct samples). Statistical analyses were done with a two-tailed Student’s t test. Data are represented as means ± SD. p Values are indicated above the bars. c RNAscope in situ hybridization with eye sections from a 3-month-old WT mouse showed that GLIS1 mRNA (yellow speckles) expression was restricted to TM and CB. Dashed lines outline different cell compartments. Kidney (Ki), Cornea (C), Retina (R), Ciliary Body (CB), Trabecular Meshwork (TM), Corneal StromaI (CS), Iris (I), and Schlemm’s canal (SC). Scale bar = 50 μm.

