Figure 5.
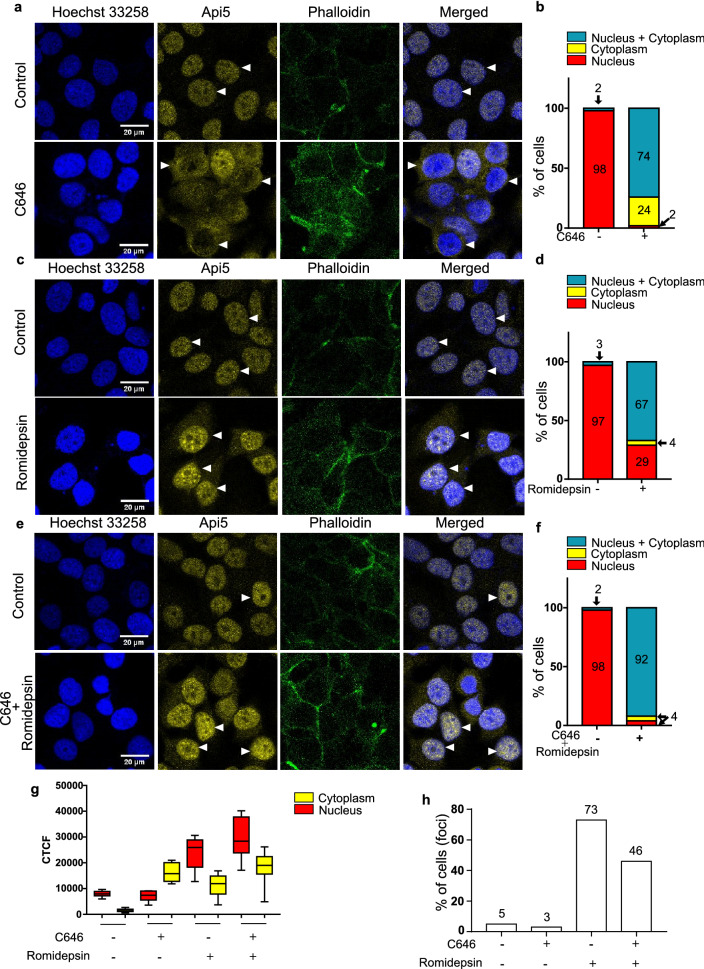
p300 and HDAC1 regulate Api5 localisation. MCF7 cells were treated with (a,b) 7.5 μM C646, (c,d) 0.1 nM romidepsin and (e,f) 7.5 μM C646 and 0.1 nM romidepsin for 4 h and 16 h, respectively. Immunofluorescence assay was performed using Api5 specific antibody and cells with different Api5 staining pattern were manually counted and analysed. The bar graph represents the percentage of cells with Api5 staining only in the nucleus (red), only in the cytoplasm (yellow) or in both (blue). (g) CTCF value of Api5 intensity in the nucleus and the cytoplasm was measured in the same experimental set up and the values are represented as box plots. Here, red corresponds to nuclear intensity and yellow corresponds to the cytoplasmic intensity of Api5. (h) Cells exhibiting Api5 nuclear foci following different inhibitor treatments were manually counted and represented as bar graphs showing percentage of cells with nuclear foci.

