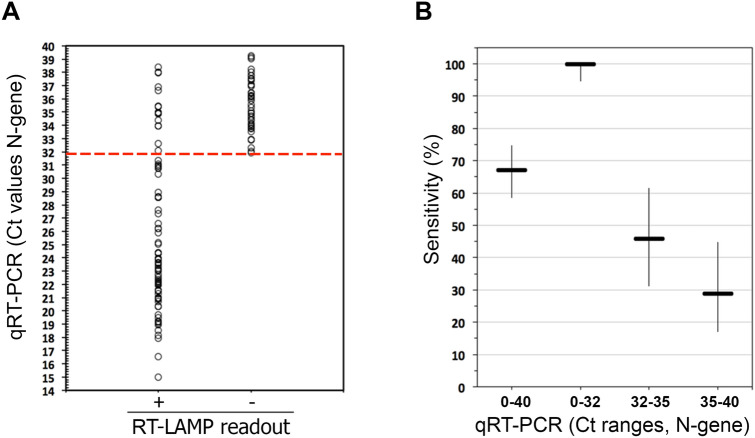
Figure 2.
Detection of SARS-CoV-2 in NP samples using RT-LAMP. (A) Comparison of RT-LAMP and RT-PCR results. The Ct values (RT-PCR results) of 126 COVID-19 positive patients (y-axis) were compared to the RT-LAMP readout (x-axis) taken after 30 min of incubation at 65 °C (positive, +/yellow; negative, −/pink). The dotted red line indicates the Ct below, which there is 100% agreement between RT-LAMP and RT-PCR. (B) Sensitivity of the RT-LAMP assay across different ranges of Ct values (which reflect different viral loads). The thicker horizontal lines indicate the specificity calculated for the indicated Ct range (according to the data of panel (A) and Table 1). The vertical lines indicate the corresponding 95% confidence intervals.

