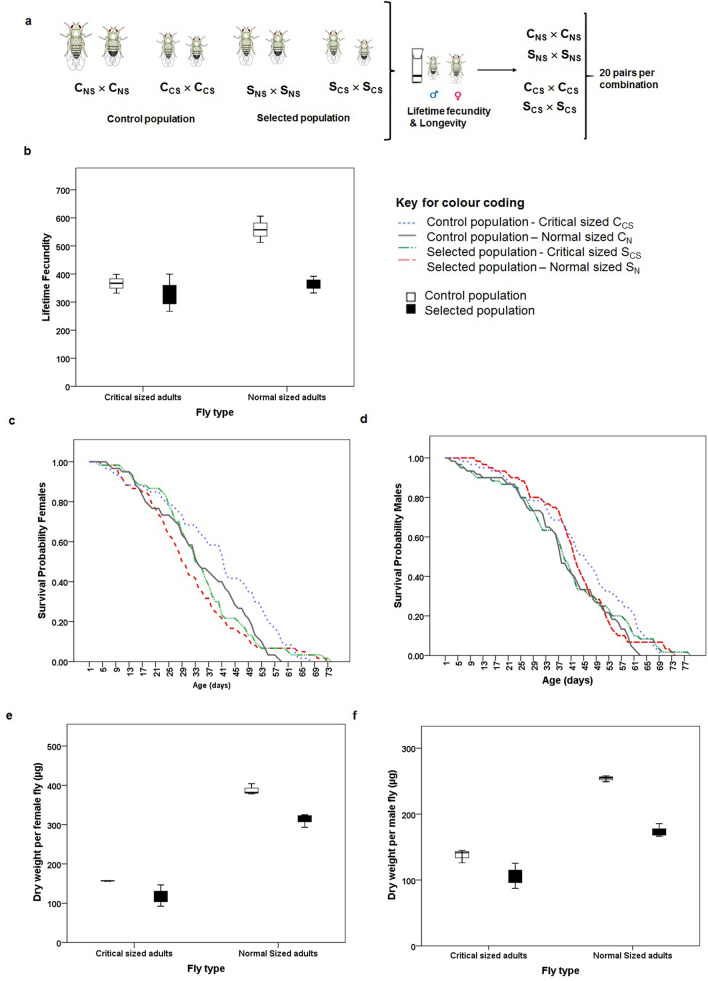
Figure 2.
(a) Specifications of pairs of flies for longevity and realized life-time fecundity assay set up. (b) realized life-time fecundity of selected and control population under critical size and normal size conditions, (c) survival probability of females, (d) survival probability of males, (e) dry weight (µg) per female fly, and (f) dry weight (µg) per male fly. Box plot is depicting the median value along with lower and upper quartile and the whiskers indicate the minimum and maximum values.

