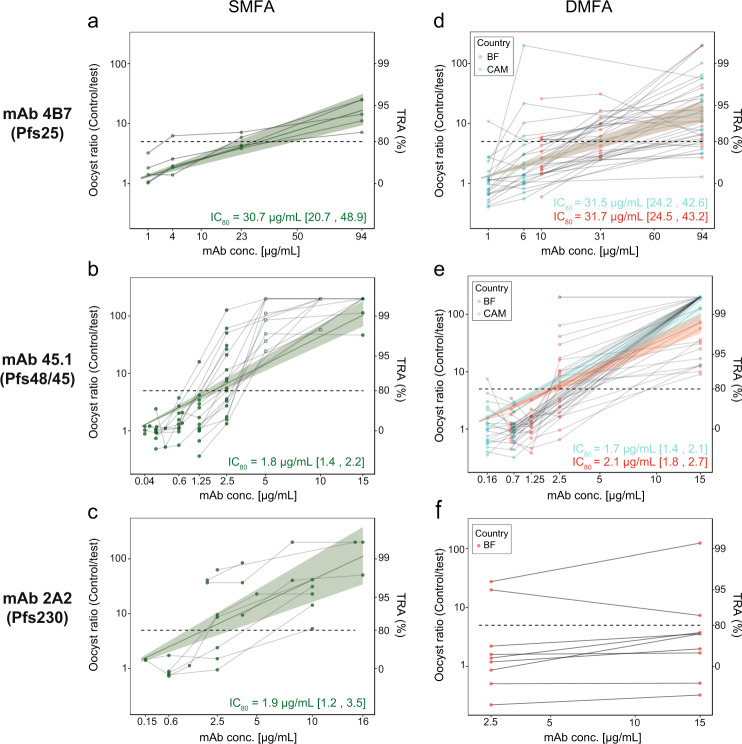
Fig. 1. Comparison of transmission-reducing activity of monoclonal antibodies against laboratory-adapted and field strains.
a–c Standard membrane feeding assays (SMFAs) were performed with cultured P. falciparum NF54 parasites and A. stephensi mosquitoes. Monoclonal antibodies (mAbs) 4B7 (Pfs25, a), 45.1 (Pfs48/45, b) and 2A2 (Pfs230, c) were added at the indicated concentrations to cultured NF54 parasites. Thin grey lines connect observations from individual feeding experiments with multiple mAb concentrations. The green line represents the overall fit from linear regression starting at the intercept (0% TRA at 0 μg/ml). Shaded area represents 95% credible intervals of the fit. mAb concentrations that were not tested in direct membrane feeding assays are omitted from the overall fit (b, open circles). d–f Direct membrane feeding assays (DMFAs) were carried out in Burkina Faso (red) and Cameroon (cyan). Thin grey lines connect observations from individual patients. mAbs 4B7 (Pfs25, d), 45.1 (Pfs48/45, e) and 2A2 (Pfs230, f) were added at the indicated concentrations to venous blood samples. For mAb 2A2 (Pfs230), DMFA was only carried out in Burkina Faso, with two concentrations per donor. The cyan and red line represent the overall fit from linear regression starting at the intercept (0% TRA at 0 μg/ml). Shaded area represents 95% credible intervals of the fit. The mAb concentration is shown on the x-axis (square root-transformed). The ratio of oocyst intensity in control conditions over antibody test conditions is shown on the left y-axis and corresponding transmission-reducing activity (TRA) on the right y-axis. An oocyst ratio of 5 equals 80% TRA, which is indicated by a dashed horizontal line. Note that transmission in some conditions was higher compared to controls, i.e. oocyst ratio <1. It is currently unclear whether this is a methodological artefact or real biological phenomenon related to low antibody density38. Calculated IC80 values are shown in graphs, with 95% credible intervals shown between brackets. The raw data for DMFA and SMFA experiments can be found in the Supplementary Material (Supplementary Dataset 1 and 2).

