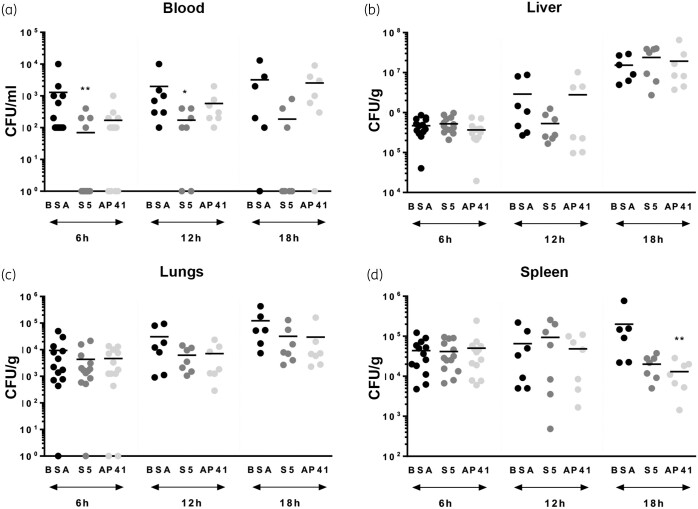
Figure 6.
Bacterial counts in pyocin-treated mice. Bacterial counts 6, 12 and 18 h post-infection in the blood (a), liver (b), lungs (c) and spleen (d) of infected mice treated with 2 μg of BSA, 2 μg of S5 or 2 μg of AP41. Asterisks indicate significant differences relative to sham-treated mice, as assessed by the Kruskal–Wallis test followed by Dunn’s multiple comparisons test (*P < 0.05; **P < 0.01). When not indicated, the differences were not statistically different.

