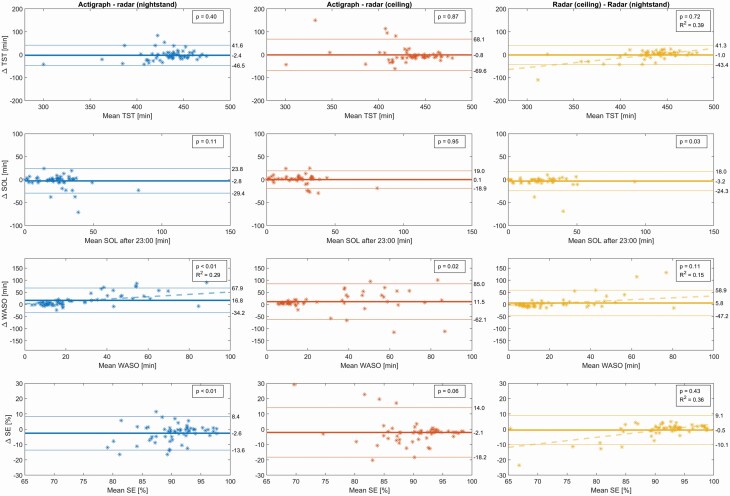
Figure 3.
Bland–Altman plots comparing the actigraph and the two radar positions for the test set of healthy volunteers. p-values from Student's t-test on the hypothesis of the bias being zero. Regression lines with corresponding R squared values are included in those subplots wherein a significant (pslope < 0.01) trend was detected. n = 12, mean age ± SD: 23.0 ± 3.1 years, 5 male, 11 nights of actigraphy + two radars per participant. The participants were randomly assigned to a training set for model development (n = 63/59 for nightstand/ceiling), and a testing set for validation (n = 63/58 for nightstand/ceiling). SOL, sleep onset latency; TST, total sleep time; WASO, wake after sleep onset; SE, sleep efficiency.

