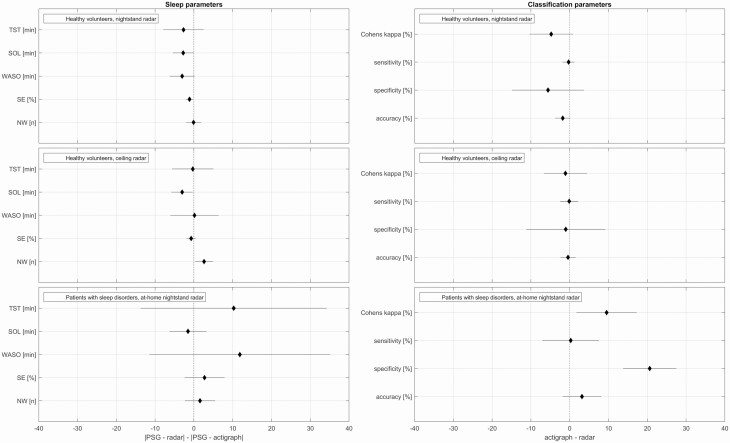
Figure 4.
Forest plots comparing the performance of the radar to that of actigraphy, using the real-time models that score the present epoch by considering it and five past epochs. Means and 95% confidence intervals of the differences. Skewing to the left of zero favours the radar. Skewing to the right favours the actigraph. From this figure, it can be inferred that hypothetical non-inferiority margins equal to 20 min for TST and 5 min for SOL would have resulted in conclusions of noninferiority for SOL in all three groups and for TST in healthy volunteers, while noninferiority could not have been claimed for patients since the upper right margin for the CI exceeds 20 min. PSG, polysomnography; SOL, sleep onset latency; TST, total sleep time; WASO, wake after sleep onset; SE, sleep efficiency; NW, number of awakenings.

