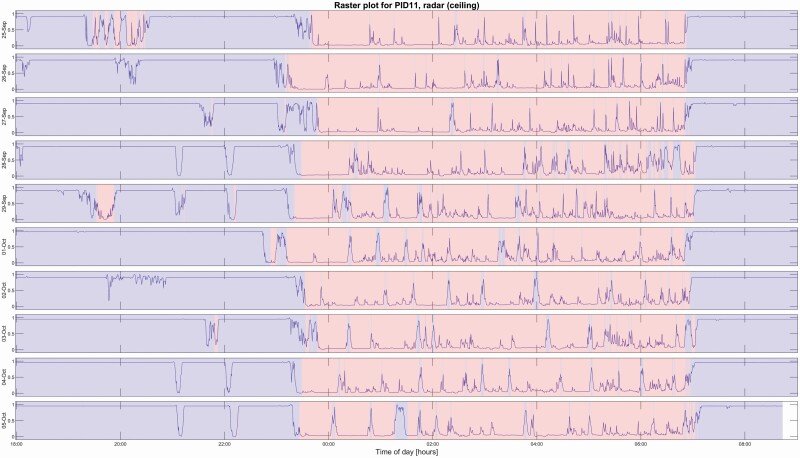
Figure 5.
Temporal raster plot generated by the ceiling-mounted radar sensor for a single healthy volunteer. The probability estimate output from the past-five-future-zero regression model is plotted as a line. Each epoch is classified as sleep/wake by comparing the probability estimate to a threshold of p = 0.5 and then re-scoring with the Cole–Kripke rules, and the resulting classification is represented by blue (wake) and red (sleep) sections in the raster plot. For reference, this participant underwent PSG on September 28th and 29th, and on October 4th and 5th, achieving a mean (±SD) epoch-by-epoch classification accuracy against PSG sleep/wake of 93.3 (±0.46) percent with corresponding Cohen's kappa values of 0.85 (±0.005) over those days.

