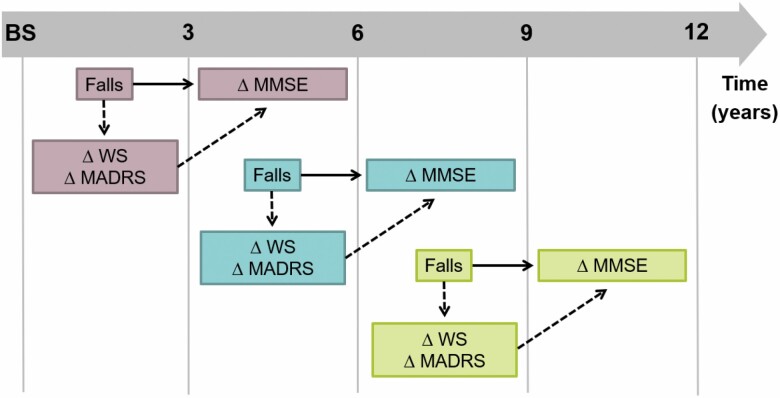
Figure 1.
Graphical schema of the exposure, mediators, and outcome considered in the linear mixed models and mediation analysis. Notes: The figure illustrates an example that is applicable to the older age cohorts, who were assessed every 3 years. Solid lines indicate the association between exposure (injurious fall) and outcome (MMSE changes). Dotted lines indicate the mediation pathway. ∆ = changes; BS = baseline; MADRS = Montgomery–Åsberg Depression Rating Scale; MMSE = Mini-Mental State Examination; WS = walking speed.

