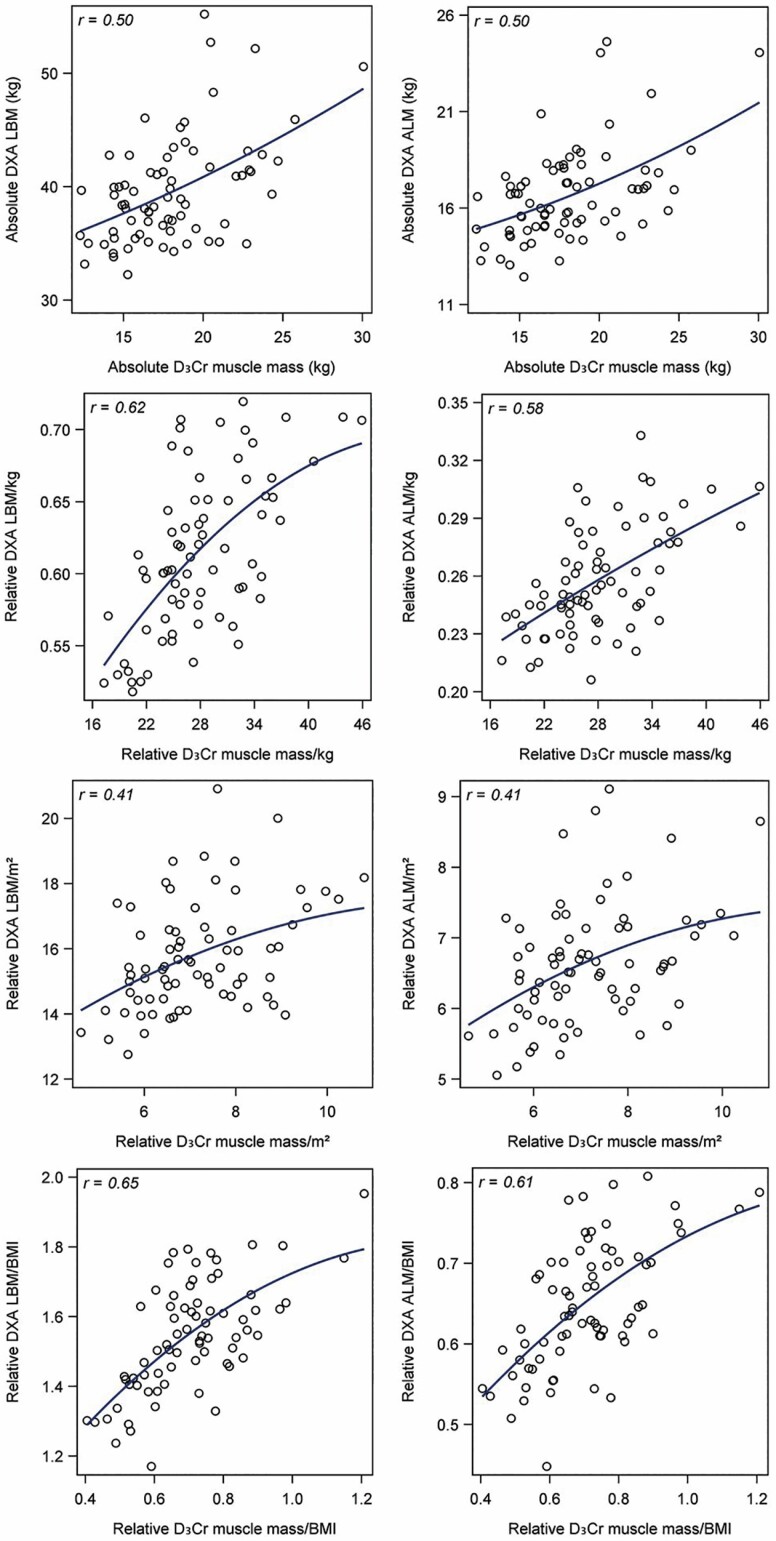
Figure 1.
Correlations between D3Cr muscle mass and DXA LBM or DXA ALM, with absolute values and values scaled to weight, height2, and BMI. ALM = appendicular lean mass; BMI = body mass index; D3Cr = D3-creatine; DXA = dual-energy x-ray absorptiometry; LBM = lean body mass. The curved line represents a quadratic prediction line.

