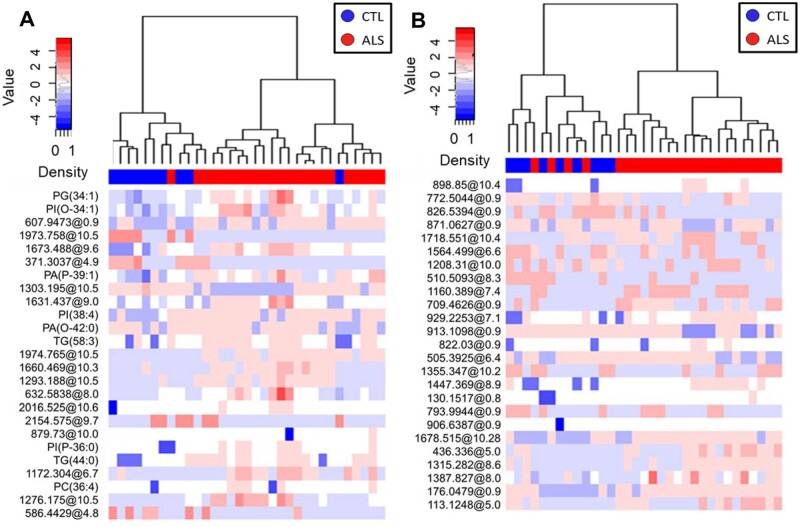
Figure 2.
Lipidomic profiles in plasma and CSF allow clustering of ALS patients and non-ALS individuals. Hierarchical clustering using the 25 lipids with the lowest P-value obtained from univariate statistics comparing plasma (A) and CSF (B) from ALS versus CTL. Each line of the heatmap represents a lipid species coloured by its abundance intensity normalized with an internal standard, log-transformed, and row-normalized using Z-scores. The scale from blue to red shows the normalized abundances in MS counts. Samples are organized in columns and ordered according to the hierarchical clustering results. We employed the Ward clustering method and Manhattan distance for hierarchical clustering. Patient groups in dendrograms are displayed with different colours: CTL (N = 10) in blue and ALS (N = 23) in red. These results show molecular findings detected in positive ionization.

