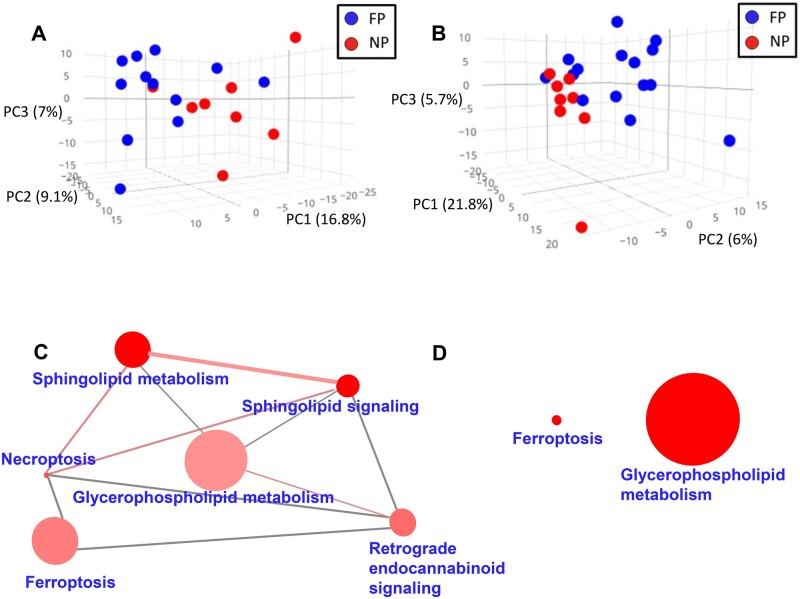
Figure 3.
Lipidomic profiles in plasma and CSF and disease progression in ALS. Plasma (A) and CSF (B) lipidomic profiles in fast progressor (FP, in blue) versus normal progressors (NP, in red). Lipids from each fraction define a graph of PCA with marked differences in plasma and CSF. Results represent molecular findings detected in positive ionization. Lipid-enriched pathways differentially down-regulated (C) and upregulated (D) lipids in plasma. The size of the nodes (pathways) is proportional to the total number of metabolites belonging to the pathway; the colour intensity is inversely proportional to the p-value of the enrichment analyses; the edge width is directly proportional to the number of common metabolites, and the edge colour intensity, directly proportional to the number of lipids differentially regulated in FP (N = 15) versus NP (N = 8). These results represent lipids detected by positive ionization.

