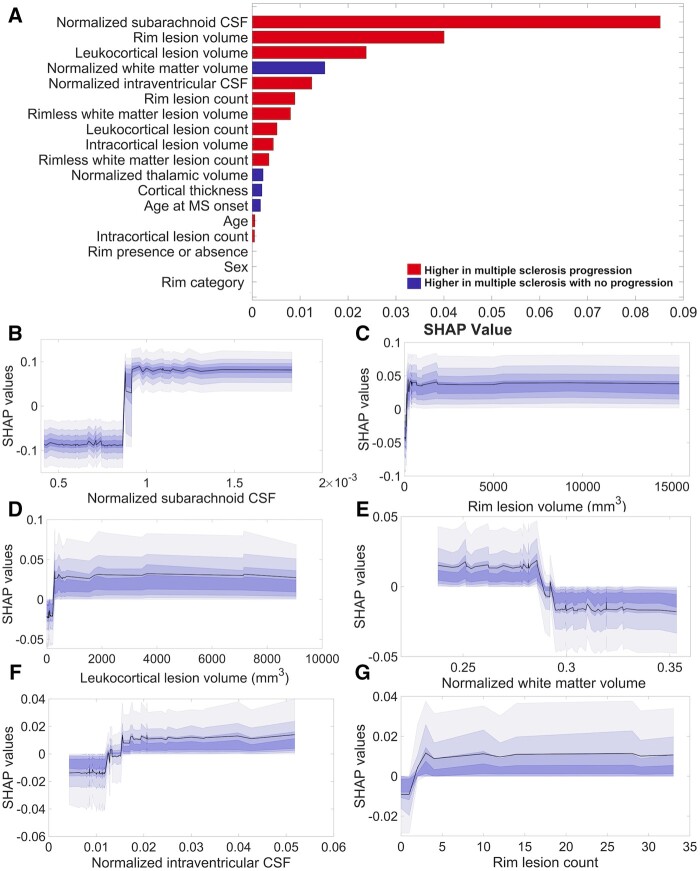
Figure 5.
Influential predictors of neurological disability progression in multiple sclerosis. The resulting SHAP features ranking (A) derived from XGBoost model lists, in descending order, starting with the most significant features in the prediction of neurological disability progression in multiple sclerosis. The model reached a mean ± SD area under the curve value of 0.69 ± 0.11, a sensitivity of 0.71 ± 0.10, an accuracy of 0.68 ± 0.09 and a specificity of 0.58 ± 0.21. The partial SHAP dependence plots (median and confidence intervals across repetitions, B–G) are shown for the top six contributors to the prediction.

