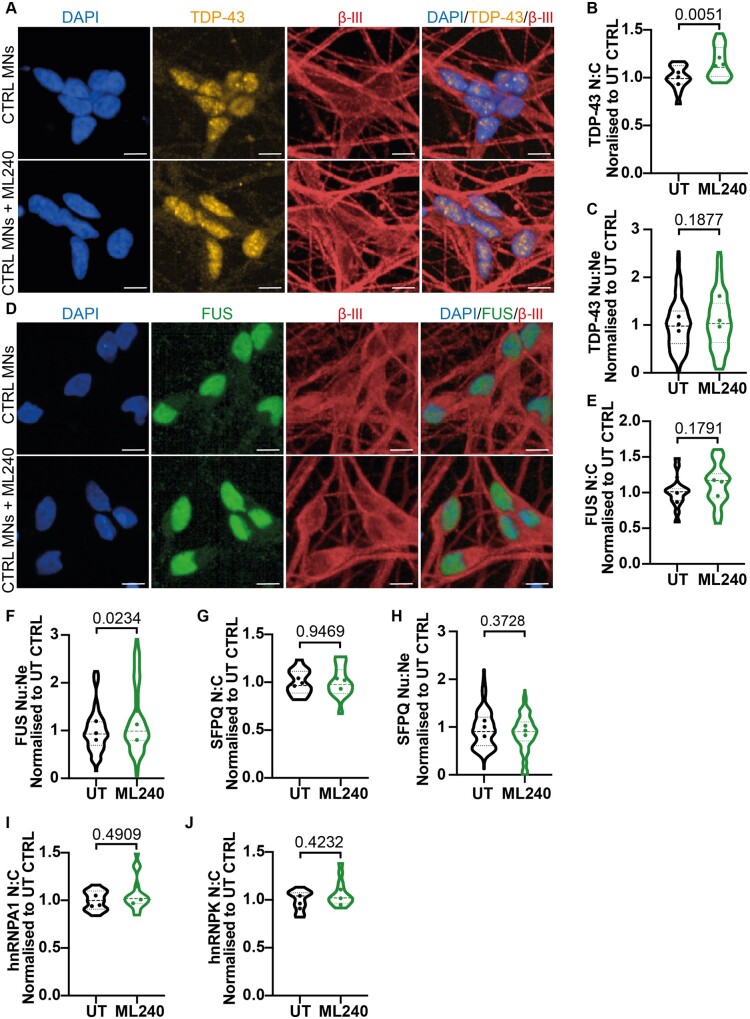
Figure 2.
Pharmacological inhibition of VCP D2 ATPase does not recapitulate ALS RBP mislocalization phenotypes in control MNs. (A) Control MNs treated with 1 μM of ML240 immunolabelled with TDP-43 and βIII-tubulin and a DAPI stain. (B) Individual cell quantification of TDP-43 displayed control MNs treated with ML240 results in an increase in the nuclear:cytoplasmic ratio (N:C). (C) There was no difference in the nuclear:neurite ratio (Nu:Ne) of TDP-43 upon ML240 treatment. (D) Control MNs treated with 1 μM of ML240 immunolabelled with FUS and βIII-tubulin and a DAPI stain. (E) Treatment of ML240 to control MNs showed no difference in the nuclear:cytoplasmic localization of FUS. (F) A small increase in the nuclear:neurite ratio of FUS upon ML240 treatment was observed. (G) There was no difference in the nuclear:cytoplasmic ratio or (H) nuclear:neurite ratio of SFPQ upon ML240 treatment. (I) There was no difference in the nuclear:cytoplasmic ratio of hnRNPA1 or (J) hnRNPK upon ML240 treatment in control MNs. Scale bar = 10 μm. Data are shown as violin plots normalized to control untreated values in each experimental repeat. Data are collected from 3 control lines across 3 independent experimental repeats using approximately the following number of cells in both untreated and treated conditions; CTRL1:3000, CTRL2:6000, CTRL3:6000. Data are shown as a violin plot with data points representing the mean of each cell line. For graphs B, E, G, I, J; data are plotted by well and the P-value is calculated from an unpaired t-test, for graphs C, F, H; data are plotted by field of view and the P-value is calculated from a Mann–Whitney test.

