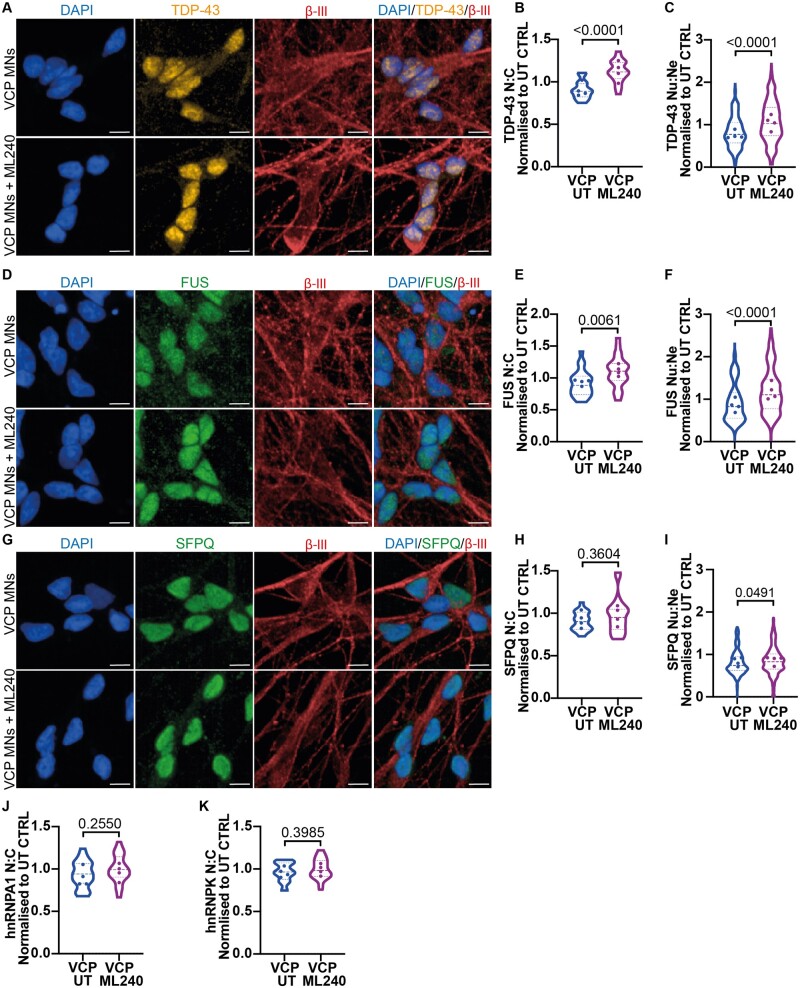
Figure 3.
Inhibition of VCP D2-ATPase domain reverses TDP-43, FUS and SFPQ mislocalization phenotypes in VCP mutant MNs. (A) VCP mutant MNs treated with 1 μM of ML240 immunolabelled with TDP-43 and βIII-tubulin. (B) Cell by cell quantification of the nuclear:cytoplasmic ratio (N:C) shows VCP mutant MNs have a loss in the nuclear:cytoplasmic ratio that is increased above control values upon ML240 treatment. (C) Quantification of TDP-43 in the neurites shows an increased nuclear:neurite ratio (Nu:Ne) upon ML240 treatment. (D) FUS and βIII-tubulin immunolabelling in VCP mutant MNs treated with ML240. (E) Quantification of FUS in the nucleus and cytoplasm identify an increase in the nuclear:cytoplasmic ratio upon ML240 treatment in VCP mutant MNs. (F) Quantification of FUS in the neurites shows an increase of the nuclear:neurite ratio to control values upon ML240 treatment. (G) VCP mutant MNs treated with ML240 and immunolabelled with SFPQ and βIII-tubulin. (H) Treatment of ML240 results in no change in the subcellular distribution of SFPQ when examining the nuclear:cytoplasmic ratio (I) but an increase when examining the nuclear:neurite ratio. (J) Quantification of hnRNPA1 shows no change in the nuclear:cytoplasmic ratio upon ML240 treatment in VCP mutant MNs. (K) Quantification of hnRNPK shows no change in the nuclear:cytoplasmic ratio upon ML240 treatment in VCP mutant MNs. Scale bars = 10 μm. Data are collected from 3 independent experimental repeats from 4 VCP mutant ALS lines analysing approximately the following number of cells; MUT1:7000, MUT2:6000, MUT3:7000, MUT4:6000. Data are normalized to control untreated values for each experimental repeat. Data are shown as violin plots with the data points representing the mean for each cell line. Data are plotted by well in graphs B, E, H, J and K and by field of view in graphs C, F and I. Graphs B, E, H and K; P-value is calculated from an unpaired t-test, for graphs C, F, I and J; P-value is calculated from a Mann–Whitney test.

