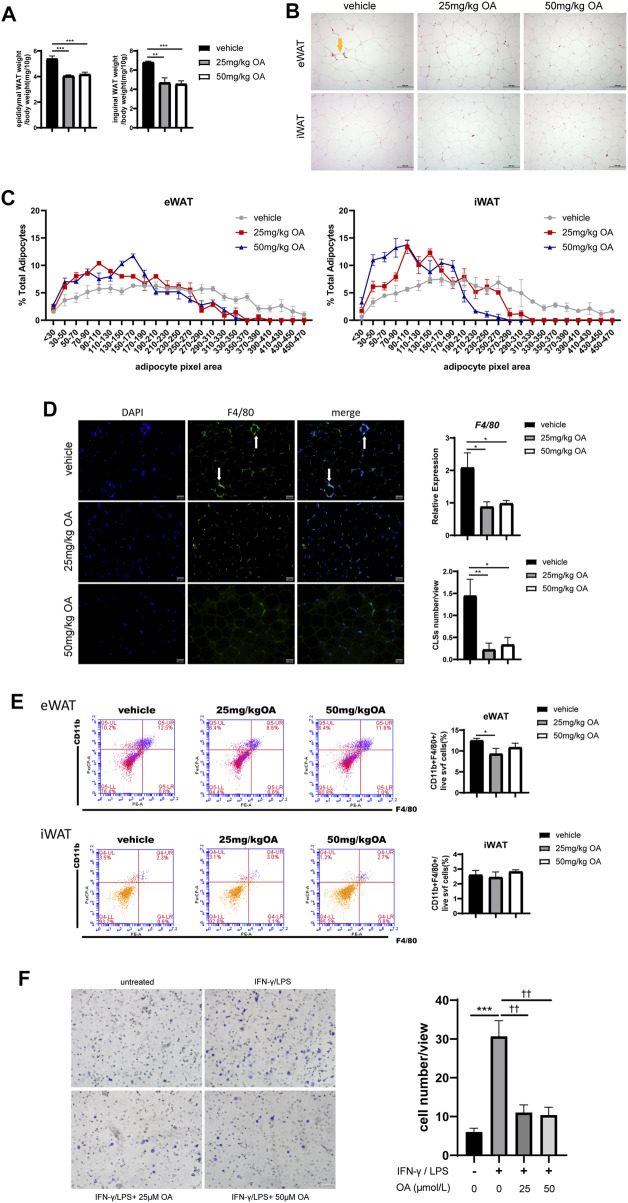
FIGURE 2.
OA diminishes adipocyte size and reduces macrophage infiltration to eWAT in DIO mice. (A) Ratio of eWAT/iWAT to body weight of mice (n = 7). (B) HE staining results of eWAT and iWAT. Scale bars = 100 µm. (C) Statistics of the adipocyte area (n = 51–76). (D) F4/80 immunofluorescence staining, mRNA expression (n = 5) and CLSs statistics (n = 9) of eWAT. Scale bars = 50 µm. (E) Representative plots and statistics of FCM analysis: total ATMs to the SVF of eWAT and iWAT (n = 5). (F) Transwell results of BMDMs, scale bar = 100 µm (n = 6).*p < 0.05, **p < 0.01, ***p < 0.001, ****p < 0.0001 vs. vehicle or control incubations, †† p < 0.01 vs. IFN-γ/LPS stimulated incubations.

