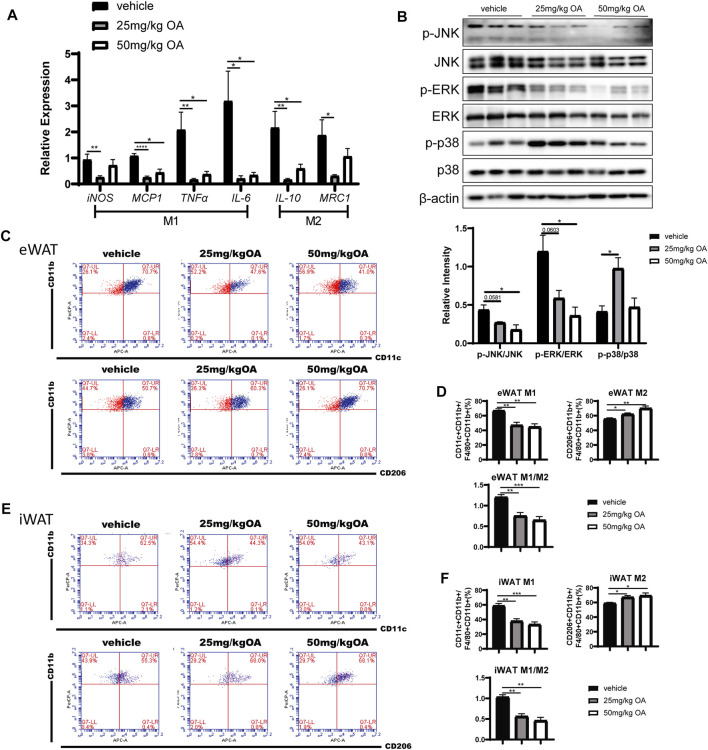
FIGURE 3.
OA decreases eWAT inflammation level and ratio of M1/M2 ATMs in DIO mice. (A) ATMs associated markers in eWAT (n = 5). (B) WB of phosphorylated p38 MAPK (p-p38 MAPK), phosphorylated JNK (p-JNK), phosphorylated ERK (p-ERK), and their total proteins in eWAT of mice. (C–F) FCM analysis of the SVF of eWAT and iWAT of mice (n = 5). (C, E) Representative plots of FCM analysis: proportion of M1 or M2 macrophages to ATMs. (D, F) Statistics of FCM analysis. Data are percentages of M1 ATMs, percentages of M2 ATMs, and M1/M2 ratios. *p < 0.05, **p < 0.01, ***p < 0.001, ****p < 0.0001.

