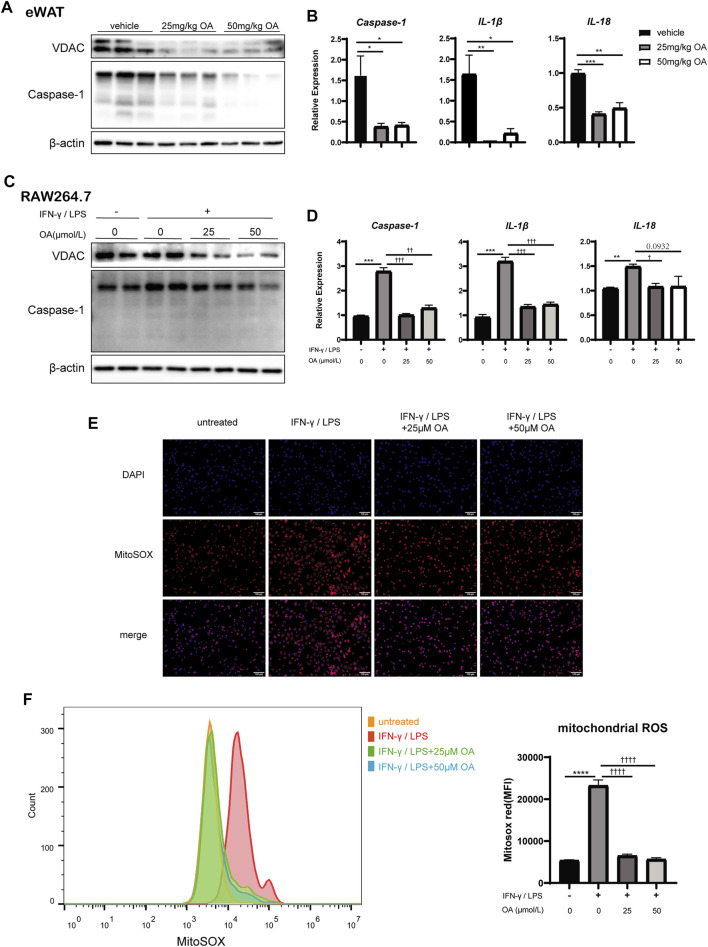
FIGURE 5.
OA decreases the expression of VDAC, the activation of NLRP3 inflammasome and the production of mitochondrial ROS in vitro and/or in vivo. (A) WB of VDAC, Caspase-1, IL-1β in eWAT of mice. (B) qPCR results of Caspase-1, IL-1β and IL-18 in eWAT (n = 5). (C) WB of VDAC, Caspase-1 in RAW264.7 macrophages. (D) qPCR results of Caspase-1, IL-1β and IL-18 in RAW264.7 macrophages (n = 3). (E) Fluorescence staining of mitochondrial ROS in RAW264.7 macrophages. (F) Fluorescence intensity of MitoSOX analyzed by FCM in RAW264.7 macrophages (n = 3–4). *p < 0.05, **p < 0.01, ***p < 0.001, ****p < 0.0001 vs. vehicle or control incubations, † p < 0.05, †† p < 0.01, ††† p < 0.001, †††† p < 0.0001 vs. IFN-γ/LPS stimulated incubations.

