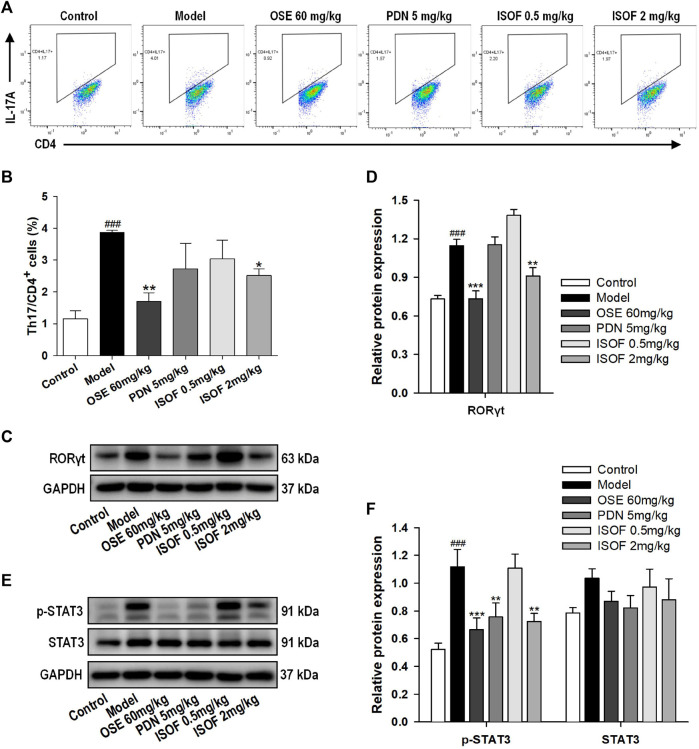
FIGURE 6.
ISOF reduced Th17 cells and the protein levels of RORγt and p-STAT3 in the lung tissues of AECOPD model mice. (A) Representative flow cytometric dot-plots of Th17 cells in the lung tissues of each group (Th17: CD4+IL-17A+ cells). (B) The proportion of Th17 cells was analyzed. (C) The protein levels of RORγt in the lung tissues of each group were assessed by western blot. (D) The relative density of RORγt to GAPDH in each group. (E) The protein levels of STAT3 and p-STAT3 in the lung tissues of each group were assessed by western blot. (F) The relative density of STAT3 or p-STAT3 to GAPDH in each group. Data are expressed as means ± SEM (n = 4 in each group). ### p < 0.001 vs. control group; *p < 0.05, **p < 0.01, and ***p < 0.001 vs. model group.

