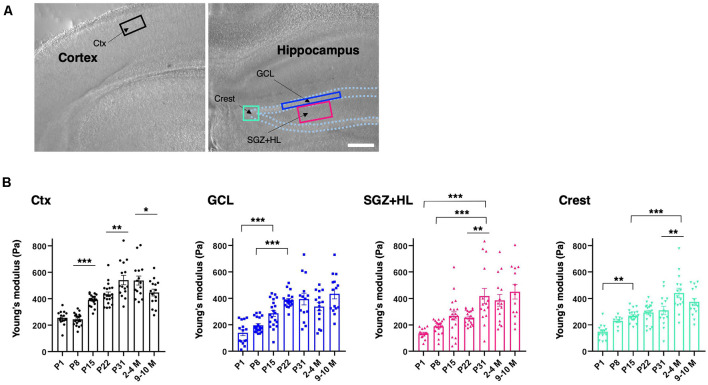
Figure 2.
Spatiotemporal shift in stiffness in the dentate gyrus (DG) as examined by atomic force microscopy (AFM). (A) The representative cortical and hippocampal areas under a bright field microscope (P8 stage). Rectangles indicate the ROIs for AFM measurement. Ctx, cortex; GCL, granule cell layer; SGZ, subgranular zone; HL, hilus. Scale bar: 200 μm. (B) The bar graph with plots presenting Young’s modulus in various subregions (black-round plots: cortex; blue-square plots: GCL; magenta-triangle plots: SGZ+HL; green-inverted triangle plots: crest of the DG). *p < 0.05, **p < 0.01, ***p < 0.001.

