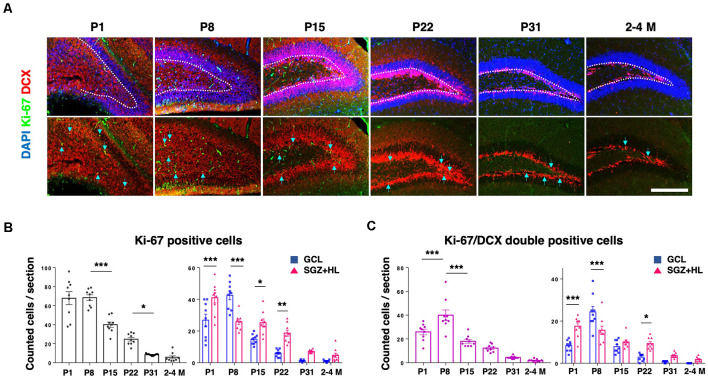
Figure 3.
The expression of Ki-67 and DCX in the DG. (A) Representative immunostaining images for Ki-67 (green), DCX (red), and DAPI (blue) at various postnatal stages. Arrows indicate Ki-67/DCX-double-positive cells. Scale bar: 200 μm. (B) Left: the number of Ki-67-positive cells in the DG in each section. Right: comparison of Ki-67-positive cells in the GCL and SGZ+HL area. (C) Left: the number of Ki-67/DCX-double-positive cells in the DG in each section. Right: comparison of the double-positive cells in the GCL and SGZ+HL area (blue-square plots: GCL; magenta-triangle plots: SGZ+HL). *p < 0.05, **p < 0.01, ***p < 0.001.

