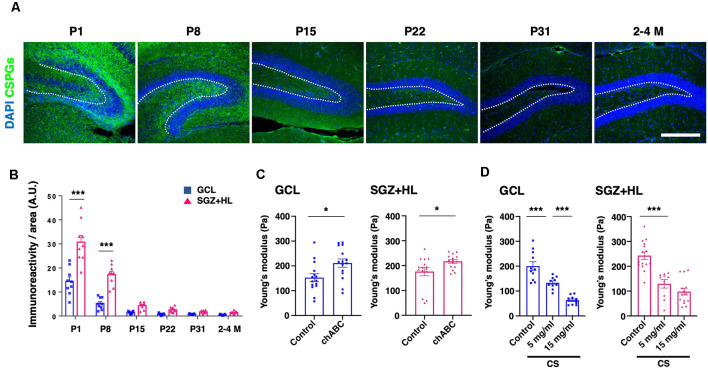
Figure 5.
The transition of CSPGs in the DG during maturation and the shift in stiffness by CSPG manipulation. (A) Representative immunostaining images for CSPGs using CS-56 antibody (green) and DAPI (blue) at various postnatal stages. The white-dotted lines represent the border between the GCL and SGZ+HL area. Scale bar: 200 μm. (B) The bar graph with plots presents a quantitative analysis of the immunoreactivity of the CSPGs in the GCL and SGZ+HL area (blue-square plots: GCL; magenta-triangle plots: SGZ+HL). (C) The bar graph with plots presents a quantitative analysis of the stiffness in the GCL and SGZ+HL area treated with chABC (blue-square plots: GCL; magenta-triangle plots: SGZ+HL). (D) The bar graph with plots presents a quantitative analysis of the stiffness in the GCL and SGZ+HL area treated with CS. Final concentrations supplied in the buffer are indicated. *p < 0.05, ***p < 0.001.

