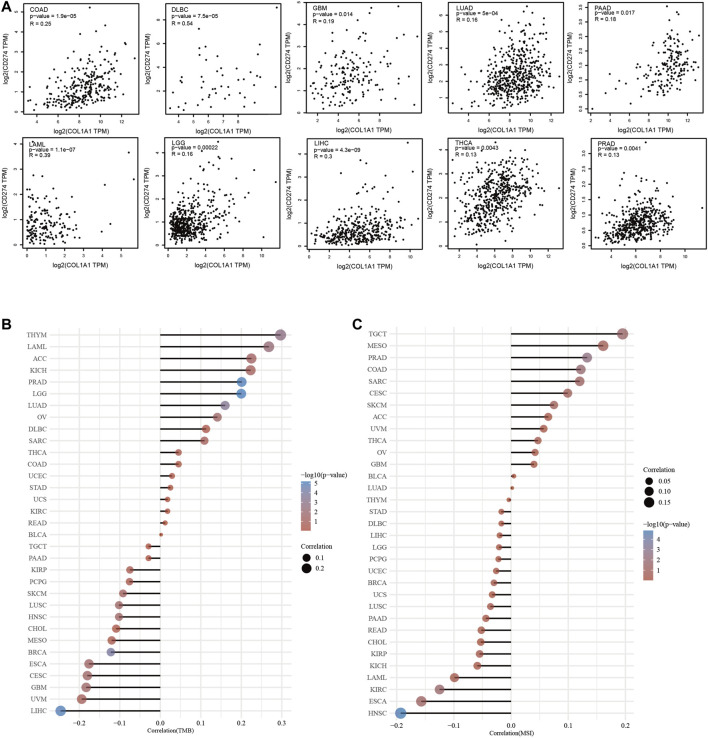
FIGURE 7.
(A) The association of COL1A1 expression and PD-L1 in COAD, DLBC, GBM, LAML, LGG, LIHC, LUAD, PAAD, PRAD, and THCA. (B) Spearman correlation analysis of TMB and COL1A1 gene expression. (C) Spearman correlation analysis of MSI and COL1A1 gene expression. The horizontal axis in the figure represents the correlation coefficient between genes and TMB/MSI, the ordinate is different tumors, the size of the dots in the figure represents the size of the correlation coefficient, and the different colors represent the significance of the p value. The bluer the color, the smaller the p value.

