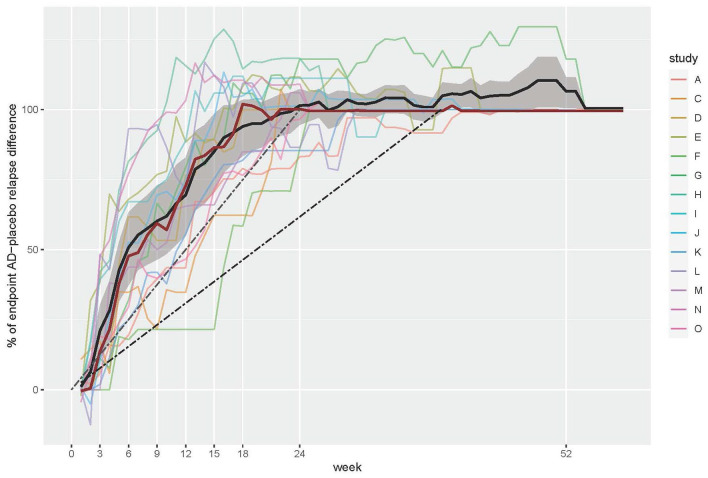
Figure 1.
Percent of AD–placebo difference in relapse events at given time points, relative to the difference at the end of the observation period (percent of total drug effect). The bold black line denotes the mean value; the bold red line denotes the median value across studies. The grey area denotes the 95% CI for the mean. The dashed black line corresponds to the expected linear drug effect (constant prophylactic effect over time) based on the mean observation period (39 weeks); the dashed grey line corresponds to the expected linear drug effect based on the minimum trial length (24 weeks).
AD, antidepressant; CI, confidence interval.

