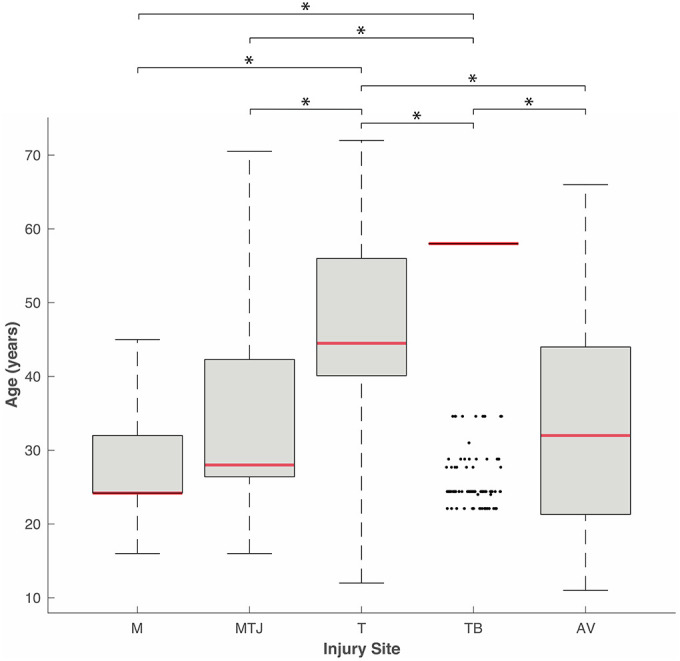
Figure 3.

Box-and-whisker plot (median, 25th percentile; range, 75th percentile) of patient age by injury site (n = 2,106). *P < .001. One-way analysis of variance. Dots appearing outside the whisker are outliers (observations numerically distant from the rest of data). AV, tendon avulsion; M, muscle belly; MTJ, musculotendinous junction; T, tendon; TB, tendon-bone junction.
