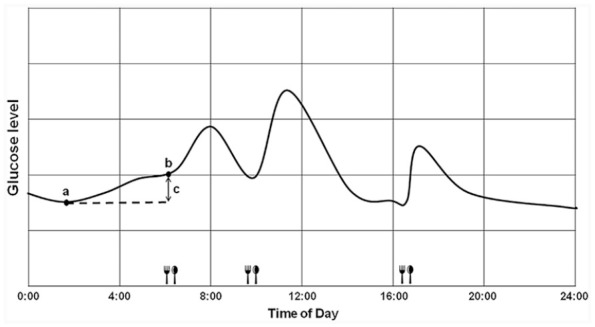
Figure 1.

Schematic representation of calculation of the dawn phenomenon (difference between nocturnal nadir and pre-breakfast glucose levels) using data from CGM. (a) Nocturnal nadir. (b) Pre-breakfast. (c) Dawn phenomenon.
CGM, continuous glucose monitoring.
