
Figure 3.
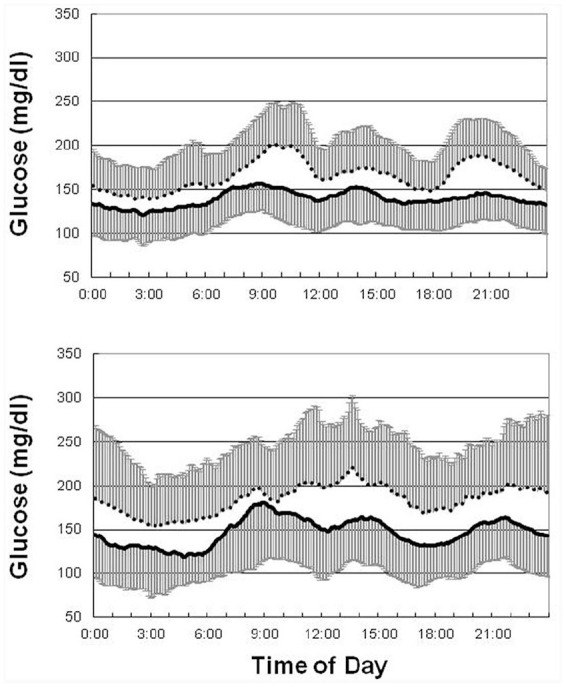
Mean 24-h glucose profiles before (dashed line) and after (solid line) treatment with acarbose (upper panel) and glibenclamide (lower panel). The error bar denotes 1 SD.
SD, standard deviation.
Official websites use .gov
A
.gov website belongs to an official
government organization in the United States.
Secure .gov websites use HTTPS
A lock (
) or https:// means you've safely
connected to the .gov website. Share sensitive
information only on official, secure websites.
Mean 24-h glucose profiles before (dashed line) and after (solid line) treatment with acarbose (upper panel) and glibenclamide (lower panel). The error bar denotes 1 SD.
SD, standard deviation.