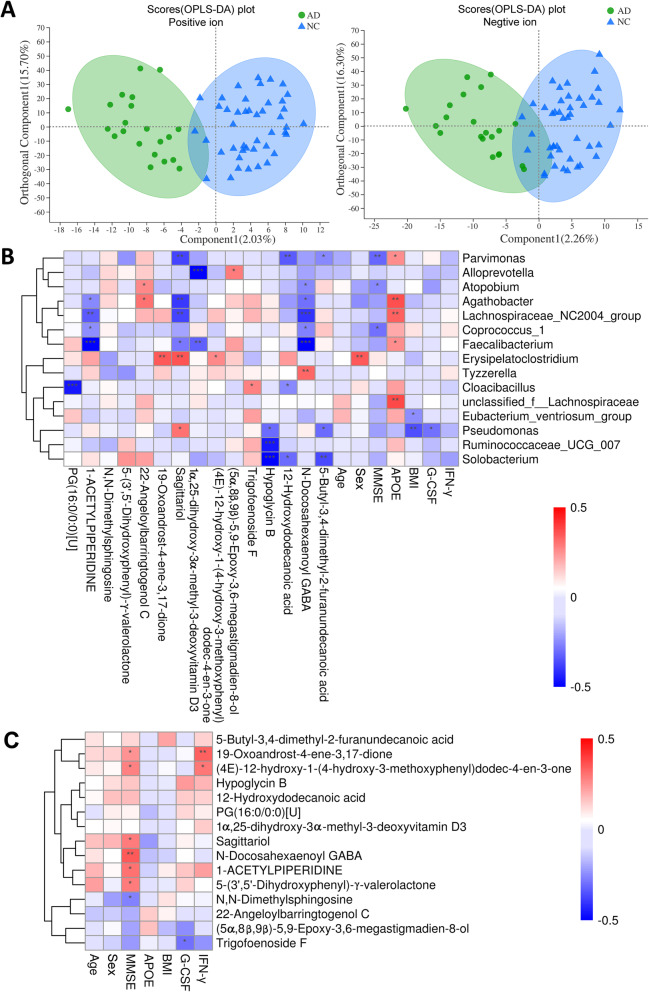
Fig. 2.
Characteristics of metabolites between AD participants and NC participants and the correlation analyses. A The orthogonal partial least-squares discriminant analysis (OPLS-DA) plot of fecal metabolites in comparisons of AD and NC groups (left: positive ion; right: negative ion). B Pearson correlation between 15 most differential genera and 15 differential metabolites, inflammatory cytokines, clinical characteristics linked with AD. The results were presented as a heatmap. Red squares indicate positive associations; blue squares indicate negative associations. *P < 0.05, ** P < 0.01, *** P < 0.001 denoted statistical significance. C Associations of fecal metabolites with inflammatory cytokines and clinical parameters. Red squares indicate positive associations; blue squares indicate negative associations. *P < 0.05; ** P < 0.01

