Fig. 2.
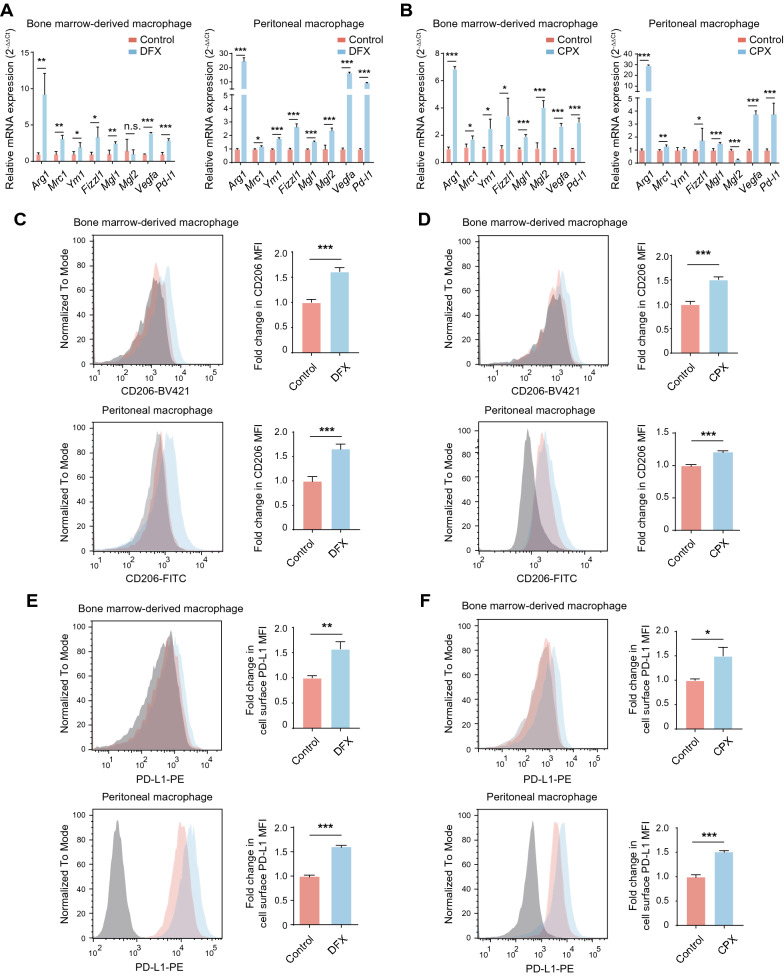
Iron deprivation drives the immunosuppressive polarization of macrophages. A, B The mRNA expression of M2 signature genes was detected in BMDMs and PMs with indicated treatment using qPCR. The results were shown as 2−ΔΔCt and were expressed as relative fold change normalized to the controls. C–F The surface expression of CD206 and PD-L1 with indicated treatment in BMDMs and PMs using FACS. The results were shown as relative fold change in MFI of CD206 and PD-L1 normalized to the controls. All data are representative of three independent experiments and presented as mean ± SD. *p < 0.05, **p < 0.01, ***p < 0.001

