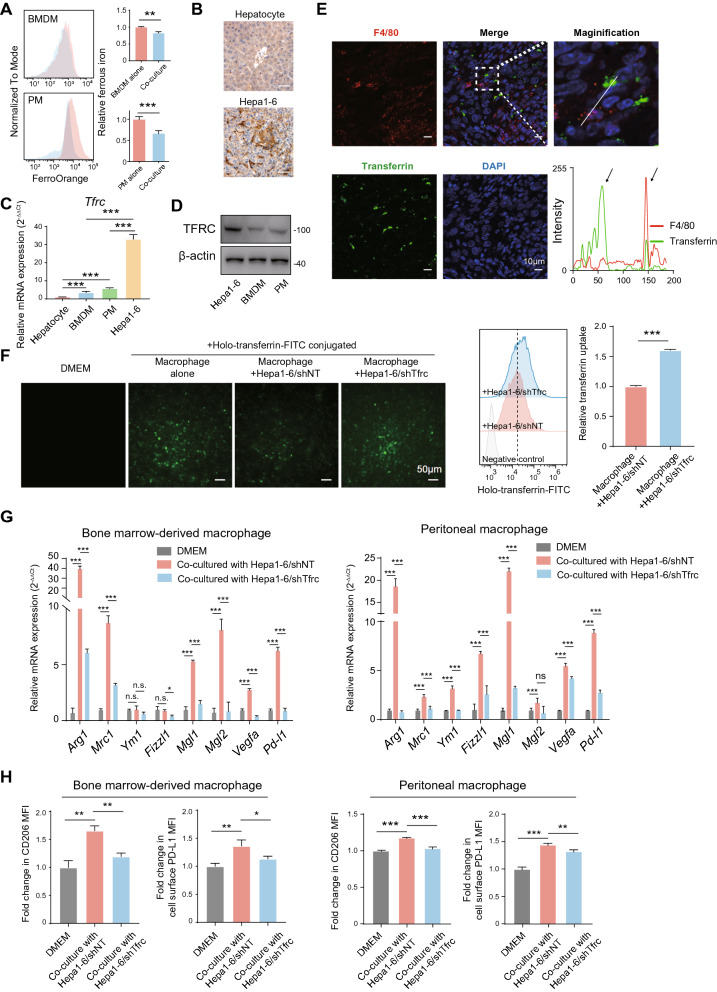
Fig. 4.
The TF/TFRC axis-mediated iron uptake by HCC cells competes for iron with macrophages and promotes M2 polarization. A BMDMs and PMs were co-cultured with indicated cells or DMEM alone, and the MFI of intracellular ferrous iron was determined by FACS. B Representative Immunohistochemistry staining of TFRC in tumor and non-tumor tissues from Hepa1-6-bearing mice. C Tfrc mRNA expression was detected in BMDMs, PMs, mouse hepatocytes, and Hepa1-6 cells by qPCR. The results were shown as 2−ΔΔCt and were expressed as relative fold changes normalized to the controls. D The protein expression of TFRC was detected in Hepa1-6 cells, BMDMs, and PMs by Western blot. E Co-localization of TF and macrophage marker F4/80 was shown. The intensity profiles of TF and F4/80 along the white line were plotted. Arrows marked the positive signals. Green: TF, red: F4/80, and blue: DAPI. Scale bar, 10 μm. F PMs and Hepa1-6 cells in the co-culture system were allowed to grow in DMEM media containing 50 ng/ml FITC-labeled holo-transferrin, and then in vitro holo-transferrin uptake assay was performed. PMs were collected 2 h later, and the MFI of FITC-transferrin was measured by FACS. G The mRNA expression of M2 signature genes in BMDMs and PMs co-cultured with indicated cells or DMEM alone was detected using qPCR. The results were shown as 2−ΔΔCt and were expressed as relative fold changes normalized to the controls. H Cell surface expression of CD206 and PD-L1 in BMDMs and PMs co-cultured with indicated cells or DMEM alone was determined by FACS. The results were shown as relative fold changes in MFI of CD206 and PD-L1 normalized to the controls. All data are representative of three independent experiments and presented as mean ± SD. **p < 0.01, ***p < 0.001

