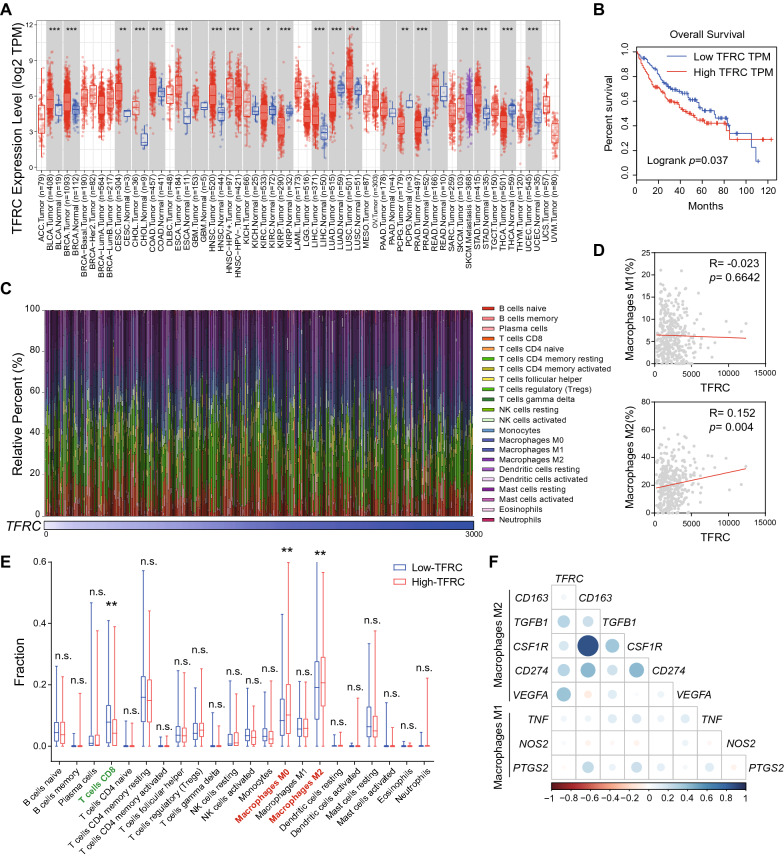
Fig. 6.
TFRC is associated with suppressive tumor immune microenvironment and poor prognosis for HCC. A TFRC mRNA expression in 33 types of TCGA tumors. B Kaplan–Meier curves for overall survival stratified according to high and low TFRC expression in TCGA LIHC database. C The relative percent of 22 types of immune cells in each LIHC sample (n = 366). D Scatter plot showing positive correlation of TFRC expression and infiltration level of M2-macrophages but not M1-macrophages in TCGA LIHC database. E The fraction of 22 types of immune cells in the Low- and High-TFRC group, respectively. Median TFRC expression serves as the cut-off to divide HCC patients into Low- and High-TFRC groups. F Correlation between TFRC and M1/M2 signature genes. Color depth and circle square represent the degrees of correlation. **p < 0.01, ***p < 0.001

