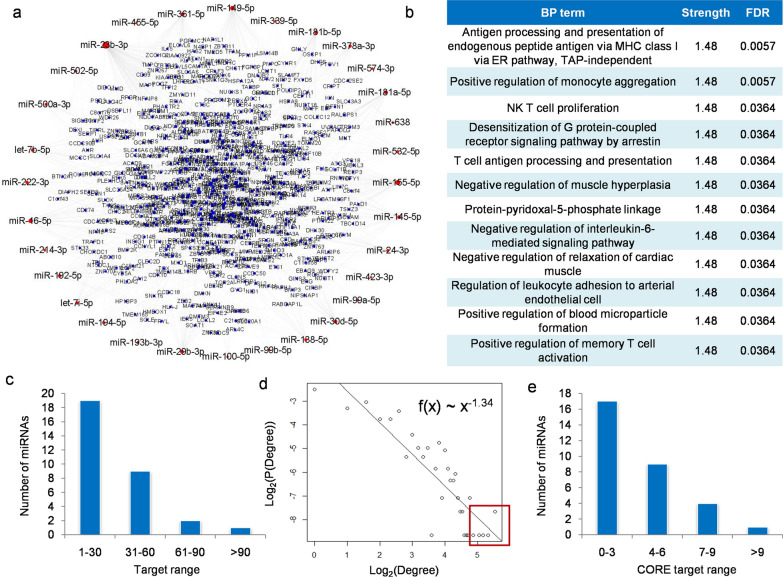
Fig. 2.
Structural characterization and prioritization of KTR-specific miR-PPIN: (a) Overview of the network. The red and blue nodes represent miRNAs and genes, respectively; (b) BP terms significantly enriched by miR-PPIN with the highest strength according to STRING online; (c) Distribution of targets at miRNA-mRNA level. miRNAs with more targets were fewer in number; (d) Degree distribution of genes at PPI level, where P (Degree) is the fraction of genes in the network with the given Degree to others. Both Degree and P (Degree) were 2-based log transformed; (e) Distribution of CORE targets at miR-PPIN level. miRNAs with more CORE targets were fewer in number

