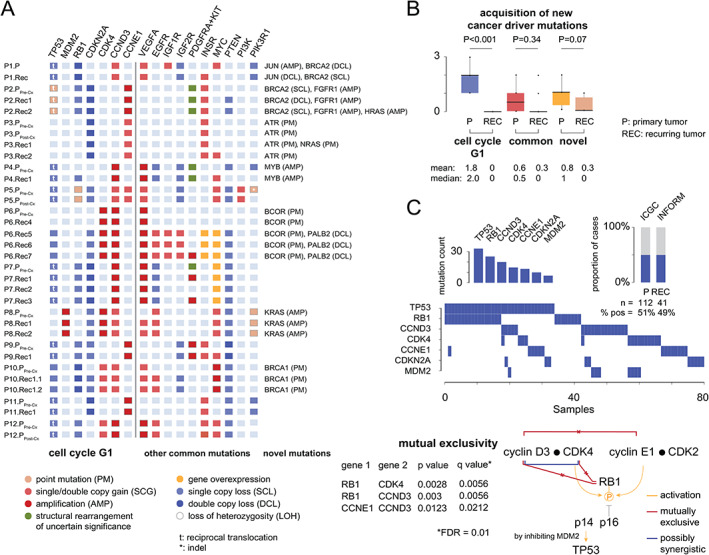
Figure 2.

Cancer driver mutations. (A) Cancer driver genes were grouped according to their known relation to osteosarcoma pathogenesis. For each gene and each tumor, different types of mutations are shown. (B) The earliest, the most pervasive, and thus clinically the most relevant mutations affect cell cycle G1 transition and are acquired prior to the clinical manifestation of the primary tumor. The box represents the upper and lower 25% quantile; the central line represents the median value. P values were calculated using paired two‐sample t‐tests and are shown above the plots. Mean and median values are shown below the plots. (C) Mutual exclusivity of cell cycle G1 mutations was validated using data from two independent studies, comprising both primary (ICGC study [5]) and metastatic osteosarcomas (INFORM study [6]). The proportion of tumors harboring mutations and the individual mutation frequencies are shown as stacked bars. The mutual exclusivity of cell cycle G1 mutations is shown below and was tested according to Canisius et al [10]. The corresponding p and q values are shown below and were calculated under the assumption of a false discovery rate of 0.01.
