
Figure 3.
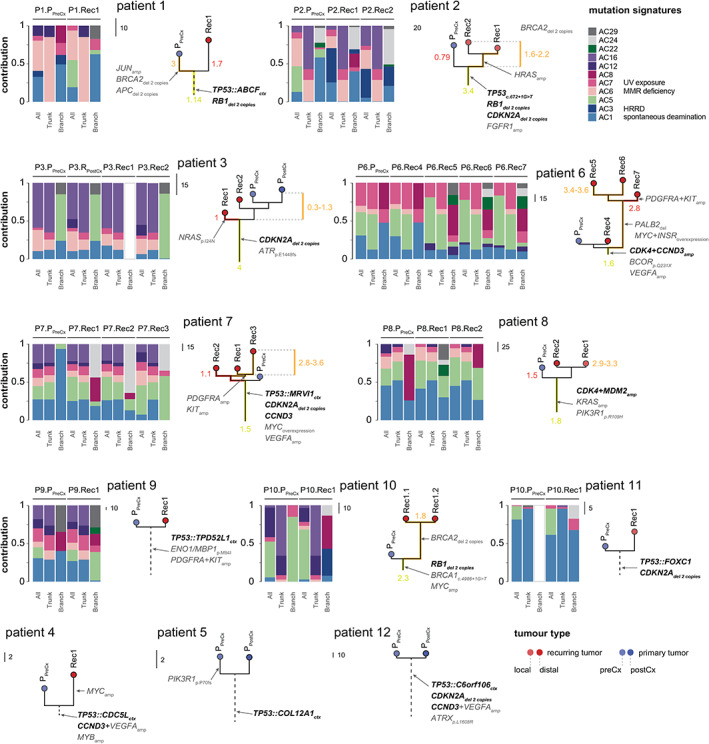
Phylogenetic analysis and mutational signatures. Maximum‐parsimony trees were constructed from exome SNVs. Cell cycle G1 mutations are depicted in bold, illustrating their enrichment on the trunks. The ratio of non‐synonymous to synonymous mutations is shown on selected phylogenies: values show the ratio of the non‐synonymous and synonymous SNVs across trunks (Tns/s) and branches (Bns/s). A higher ratio is indicative of an increased number of non‐synonymous mutations and therefore potentially also of selective benefits. Mutational signature analysis is shown next: stacked bar plots show the relative contribution of individual mutation signatures, split between mutations occurring at the phylogenetic trunk and branches/leaves. Mutational signatures are not shown for tumors that acquired fewer than ten somatic SNVs. amp, amplification; ctx, chromosomal translocation; del, deletion; HRRD, homologous recombination repair deficiency; MMR, mismatch repair of DNA.