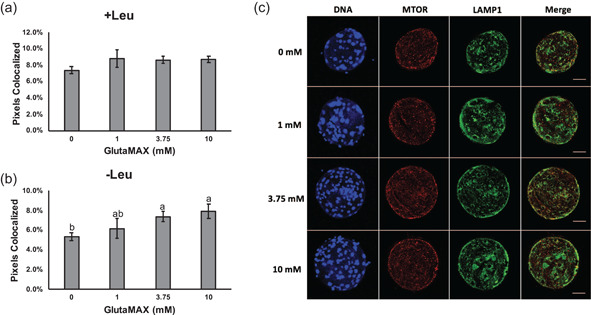
Figure 4.

Colocalization of MTOR and LAMP1 in porcine blastocyst‐stage embryos as an indicator of mTORC1 activation. Percentage of MTOR and LAMP1 pixels colocalized for embryos cultured with (a) leucine and without (b) leucine. Data presented as mean ± SEM across three replicates (n = 15 embryos per concentration). Different letters (a,b) indicate statistical differences (p < 0.05). Absence of superscripts above bars indicates that statistical differences were not observed between any of the groups (p > 0.05). (c) Representative images of embryos cultured in different concentrations of GlutaMAX without leucine and stained for DNA (Hoechst 33342), MTOR, and LAMP1. Scale bars = 50 μm. RPS6K, ribosomal protein S6 kinase
