Figure 6.

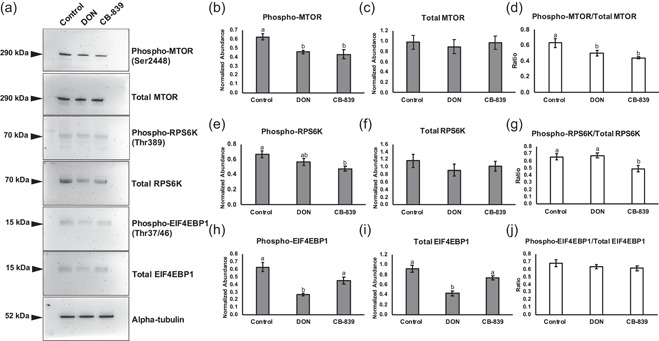
Western blot analysis of phosphorylated MTOR (Ser2448), total MTOR, phosphorylated RPS6K (Thr389), total RPS6K, phosphorylated EIF4EBP1 (Thr37/46), and total EIF4EBP1 for blastocyst‐stage embryos cultured GLS inhibitors. (a) Representative blots for embryos cultured in MU3 (control), MU3 with 500 µM DON, or MU3 with 10 µM CB‐839. Target protein molecular weights in kilodaltons (kDa) are depicted to the left of each blot. Alpha‐tubulin was used as the loading control. Densitometry analysis across three replicates (n = 100 embryos per treatment) for (b) phosphorylated MTOR, (c) total MTOR, (d) ratio of phosphorylated to total MTOR, (e) phosphorylated RPS6K, (f) total RPS6K, (g) ratio of phosphorylated to total RPS6K, (h) phosphorylated EIF4EBP1, (i) total EIF4EBP1, and (j) ratio of phosphorylated to total EIF4EBP1. Different letters (a,b) indicate statistical differences (p < 0.05). Absence of superscripts above bars indicates that statistical differences were not observed between any of the groups (p > 0.05). DON, 6‐diazo‐5‐oxo‐l‐norleucine; GLS, glutaminase; RPS6K, ribosomal protein S6 kinase
