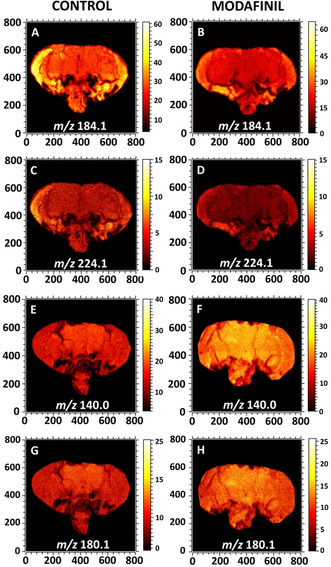
Figure 1.

ToF‐SIMS images display the distribution of lipid headgroup fragments in fly brain sections of control (left column) and modafinil‐treated (right column) flies analyzed with ToF‐SIMS. A),B) Ion images of the PC and SM head group at m/z 184.1 in the positive ion mode; C),D) PC fragment at m/z 224.1 in the positive ion mode; and E)–H) PE fragments at m/z 140.0 and 180.1 in the negative ion mode. All the images were recorded with the ToF.SIMS V instrument equipped with 25 keV Bi3 ++ as a primary ion beam. The primary ion beam current was 0.3 pA and the total ion dose was 2×10¹² ions cm−2.
