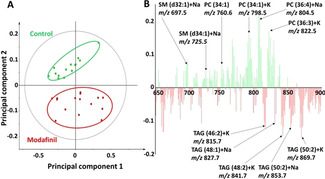
Figure 2.

PCA of the positive ion mode data of the central brain regions of control versus modafinil‐treated flies from the ToF‐SIMS experiments. A) Score plot of principal component 1 versus principal component 2 from the spectra. B) Corresponding loading plot of the principal component 2 shows the peaks contributing to the separation of the two fly groups. The data from 12 control and 15 treated flies were used for PCA.
