
Figure 5.
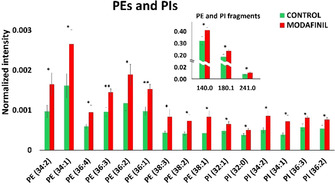
Relative quantification of PE and PI species in the central brains of control and modafinil‐treated Drosophila. Data were collected from 24 flies for both groups. Green and red bars correspond to control and modafinil‐treated groups, respectively. The error bars represent SEM. PE and PI species were detected as [M−H]−. *: p<0.05, **: p<0.01.