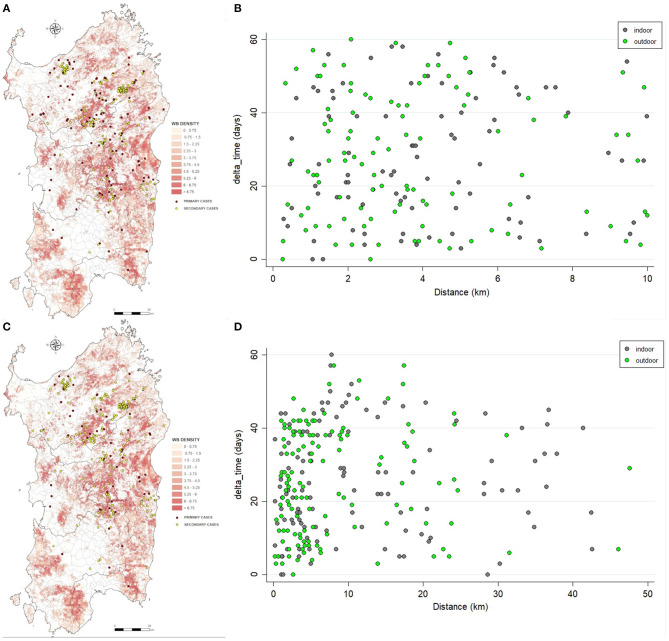
Figure 5.
Spatial distribution of the primary (red) and secondary cases (yellow) detected by nearest-neighbor (A) or uniform-smoothed kernel functions (C). Scatterplots shown the relation between difference time and distance between the secondary outbreak and its primary outbreak, by nearest-neighbor (B) or uniform-smoothed kernel functions (D).

