Figure 8.

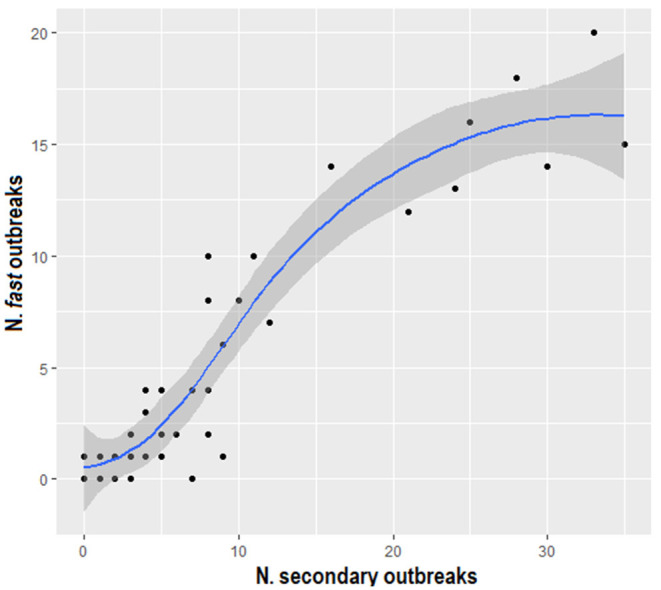
Scatter plot displaying the number of fast outbreaks versus the number of secondary outbreaks, using both the nearest-neighbor and the uniform kernel functions.

Scatter plot displaying the number of fast outbreaks versus the number of secondary outbreaks, using both the nearest-neighbor and the uniform kernel functions.