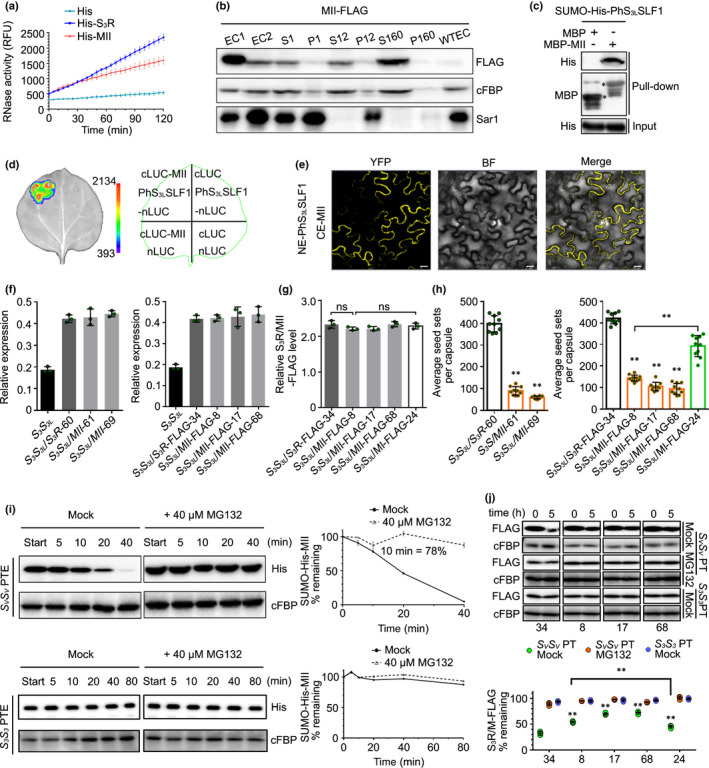
Fig. 2.

Petunia hybrida S3‐RNase with mutated region (R) II significantly inhibits cross seed sets. (a) RNase activity detection of His‐S3R and mutant (M) II expressed by pCold‐TF vectors. The relative fluorescence unit (RFU) indicating RNase activity during a time‐course experiment is shown as mean ± SD (n = 3). II: the ubiquitinated region II of PhS3‐RNase. (b) Immunoblot detection of FLAG‐tagged MII in subcellular fractions of in vitro germinated pollen tubes. EC1, EC2 and WTEC indicate entire cell homogenates of the pistils from the transgenic plants containing MII‐FLAG, the pollen tubes of PhSVSV treated with EC1 and the pistils from wild‐type PhS3S3L . WTEC was a negative control. S1 and P1, S12 and P12, S160 and P160 indicate supernatant and pellet fractions obtained by centrifugation of EC2 at 1000 g, 12 000 g and 160 000 g, respectively. cFBP and Sar1 are respective marker antibodies of cytosol and endoplasmic reticulum (ER). (c) Physical interactions between PhS3LSLF1 and MII detected by pull‐down assay. Input and pull‐down: bait protein SUMO‐His‐PhS3LSLF1 and prey proteins detected by immunoblots, respectively. MBP and SUMO‐His are protein tags. Asterisks indicate bands of target proteins. (d) Split firefly luciferase complementation (SFLC) assay. The numbers on the left side of the colour signal bars represent the values of the fluorescent signal. The injection positions of each component on tobacco leaves are indicated in the contour diagram of leaf margin. nLUC and cLUC indicate transiently expressed N‐terminal and C‐terminal regions of luciferase. (e) Bimolecular fluorescence complementation (BiFC) assay. NE and CE: transiently expressed N‐terminal and C‐terminal regions of YFP by pSPYNE and pSPYCE vectors. YFP, BF and Merge represent the YFP fluorescence, bright field and their merged field, respectively. Bars, 20 μm. (f) Transcripts of the transgene and native PhS3 ‐RNase detected by qRT‐PCR. The T0 transgenic lines are indicated below the horizontal axes. S3S3L is a wild‐type. Data are shown as mean ± SD (n = 3). (g) Quantitative analyses of S3R‐ and MII‐FLAG proteins. The T0 transgenic lines are indicated below the horizontal axes. Data are shown as mean ± SD (n = 3). Student’s t‐test was used to generate the P‐values. ns (not significant), P > 0.05. (h) Statistical analyses of seed sets per capsule from T0 transgenic plants pollinated with cross‐pollen of PhSVSV . Data are shown as mean ± SD (n ≥ 9). Student’s t‐test was used to generate the P‐values. **, P < 0.01. (i) Cell‐free degradation of recombinant SUMO‐His‐MII by pollen‐tube extracts (PTE) of PhSVSV or PhS3S3 . Left, immunoblots of the reaction products incubated with or without MG132 (Mock). Start, time point zero in each degradation assay. cFBP antibody was used to detect nondegraded loading control. Right, quantitative analyses of the degradation rates. Data are shown as mean ± SD (n = 3). The remaining amount at 10 min is indicated. (j) Time‐course analyses of PhS3R‐FLAG and MII‐FLAG levels in the cross‐pollen tubes (PTs) (PhSVSV ) or self‐PTs (PhS3S3 ) incubated with or without MG132 (Mock). PhSVSV and PhS3S3 PTs were challenged with style extracts of PhS3S3L /PhS3R‐FLAG or PhS3S3L /MII‐FLAG for 5 h to mimic cross‐pollination and self‐pollination, respectively. Top, immunoblots of PhS3R‐FLAG or MII‐FLAG in the PT using FLAG antibody. cFBP was detected as a loading control. The numbers at the bottom indicate the transgenic line numbers corresponding to those in (h). Bottom, quantitative analyses of the immunoblots. Data are shown as mean ± SD (n = 3). Student’s t‐test was used to generate the P‐values. **, P < 0.01.
