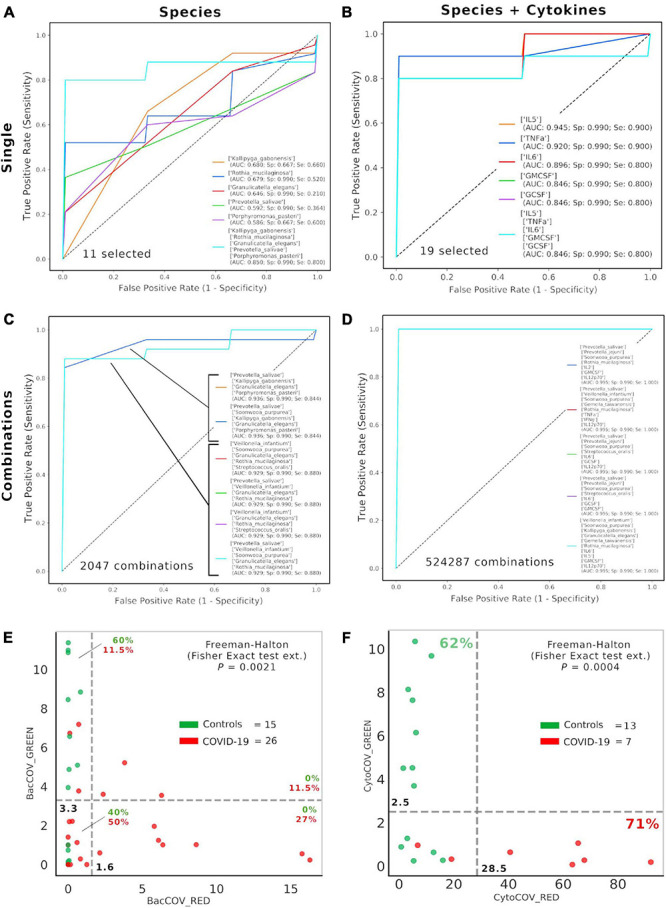
FIGURE 4.

Consortia of bacteria and cytokines predict COVID-19 status. Receiver Operating Characteristic (ROC) with fivefold cross-validation and C-Support Vector Machine classifier was employed to assess the best oral bacterial species (among 11 selected, (A) or species plus cytokines (among 19 selected, (B) able to predict COVID-19 status. Each panel reports the best five Area Under Curve (AUC) values in descending order (see the inset legend also showing specificity, Sp, and sensitivity, Se, for each ROC curve), plus a sixth curve encompassing the preceding five grouped. Combinations were computed for selected species (n = 11, 2,047 combinations, (C) and species plus cytokines (n = 19, 524,287 combinations, (D), and the best “consortia” predicting COVID-19 are shown along with their AUC, Sp and Se values. BacCOV (E) and CytoCOV (F) parameters were computed and divided into their GREEN (species and cytokines higher in controls) and RED (species and cytokines higher in COVID-19) components and employed to generate scatterplot 2D graphs. Abundance thresholds (computed as in Supplementary Table 5) are shown as dotted gray lines, and their values are reported in bold. In each quadrant of panels E and F are reported the percentages of controls (green) or COVID-19 subjects (red).
