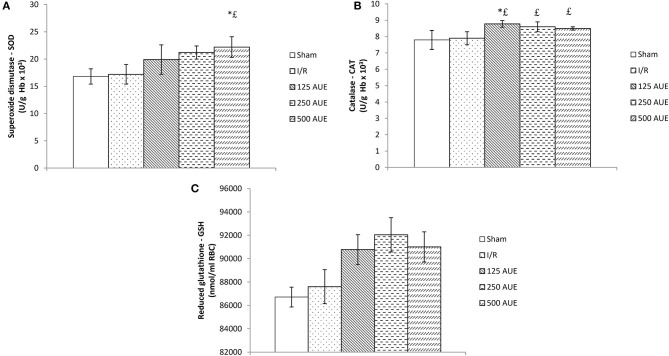
Figure 4.
Effects of consumption of increasing doses of AUE on the value of superoxide dismutase (SOD) (A), catalase (CAT) (B), and reduced glutathione (GSH) (C) (n = 50, 10 animals per group). Values are shown as mean ± SE. *Statistically significant difference at the level of p < 0.05 in relation to the I/R group;£Statistically significant difference at the level of p < 0.05 compared to sham. n = 10 animals per group.

