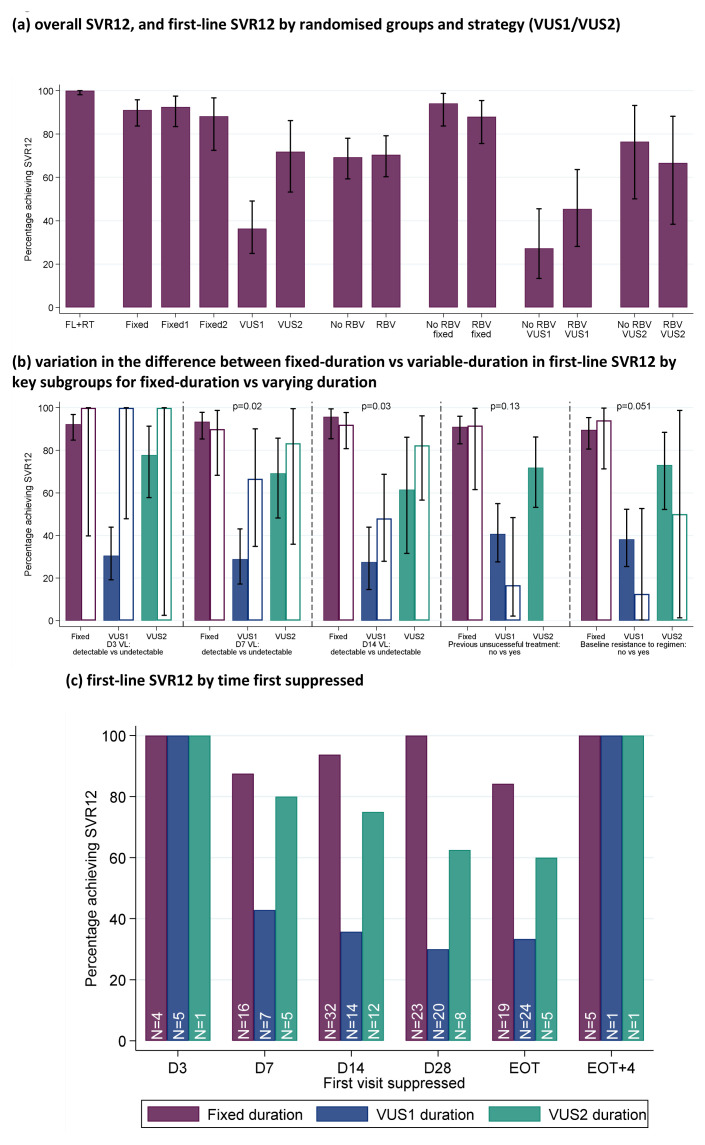
Figure 7. SVR12.
( a) overall SVR12, and first-line SVR12 by randomised groups and strategies (VUS1/VUS2). ( b) variation in the difference between fixed-duration vs variable-duration in first-line SVR12 by key subgroups. ( c) first-line SVR12 by time first suppressed. Note: FL=first-line, RT=retreatment. Fixed = overall SVR12 for 8 week therapy. Fixed1=fixed duration when VUS duration received VUS1, Fixed2=fixed duration when VUS duration received VUS2. In panel ( b), solid bars represent the first subgroup (detectable VL at the various days shown, no previous unsuccessful treatment, no baseline resistance to drugs taken first-line) and empty bars the second subgroup (undetectable VL at the various days shown, previous unsuccessful treatment, baseline resistance to drugs taken first-line). p-values are heterogeneity p-values comparing the difference between fixed vs VUS1/VUS2 strategies across the two subgroups. Heterogeneity p-value for D3 VL cannot be estimated due to perfect prediction. Panel (c) does not include 8 patients who never had VL suppression; for patients allocated 28–31 days, their EOT visit is also their 28 day visit and they are included in each group.

