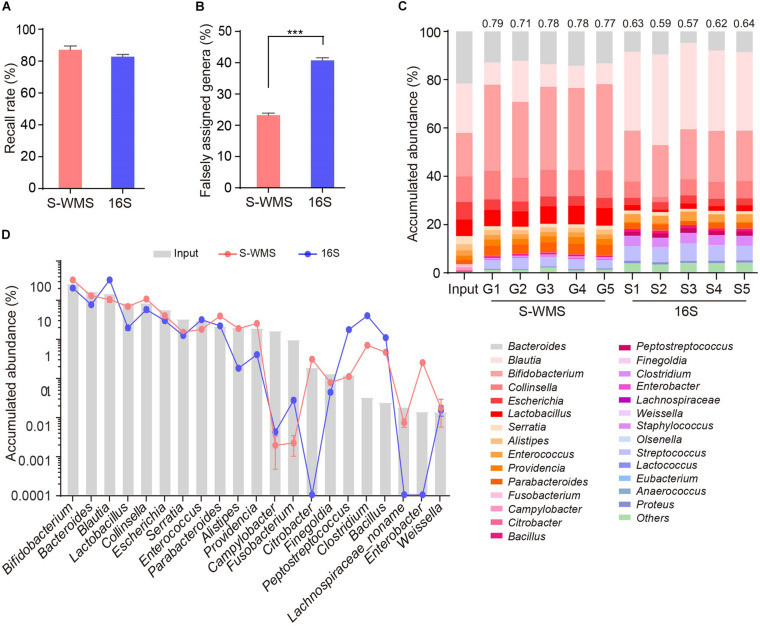
FIGURE 3.
Genus composition of a high-complexity artificial microbial community (MOCK2) assessed by shallow WMS or 16S. (A) Genus recall rate. (B) Falsely assigned genus rate by 16S or S-WMS. (C) Stacked bar plot of genera abundances. The values on top of the bar graph indicate the Spearman correlation coefficient between S-WMS/16S data and the actual (Input) values. (D) The relative abundance of dominant genera determined by 16S or S-WMS. The gray bars indicate the actual (Input) value. Sixty-three gut bacterial species (belonging to 28 genera) were cultured under standard laboratory conditions. The artificial community was sequenced five times by each approach. ***p < 0.001.

